USD/CADSELL @ 1.35007
TP @ 1.31814
SL @ 1.35196
Usd/cad is expected to move well due to the rate news
Trade ideas

USDCAD- 1DThe Dollar has been weaker for this time and thus all the dollar pairs seems to be bearish. This setup looks good for selling opportunity and aiming for 1.3370.
Note- This is my own analysis and thus not to be considered as trading signal, before making any decisions kindly do your own research, as trading is highly risky.

USDCAD LONGHey yall welcome back to another trade with FX:USDCAD with #ICT #OTE model
here we can seee entry gonna tap and let see whats gonna cookin for us #LFG

USDCAD rises within rising wedge ahead of Canada inflationUSDCAD prints a three-day winning streak despite mildly bid Oil price, bracing for the monthly Canada inflation numbers within a seven-week-old rising wedge bearish chart formation. In doing so, the Loonie pair extends last week’s rebound from a 200-bar Exponential Moving Average (EMA) backed by the price-positive RSI conditions and a looming bull cross on the MACD. With this, the quote is likely to extend the latest run-up toward a month-long horizontal resistance surrounding 1.3535-40. Following that, the stated wedge’s top line, close to the 1.3600 threshold, will be in the spotlight. In a case where the pair price remains firmer past 1.3600, it defies the bearish chart pattern and enables the buyers to aim for the late 2023 highs.
Meanwhile, a convergence of the 200-EMA and the aforementioned rising wedge’s lower line, near 1.3465 by the press time, puts a floor under the USDCAD price. Should the quote break the stated key support, it confirms the bearish chart formation and highlights a theoretical target of 1.3050. However, lows marked during late January and December, around 1.3360 and 1.3180 respectively, could test the Loonie pair bears during the fall past 1.3465. Additionally acting as a downside filter is the 1.3000 psychological magnet.
Overall, the USDCAD is likely to extend its recent run-up within a bearish chart formation unless today’s Canada data and the latest increase in Oil price, Canada’s key export, propel the Canadian Dollar (CAD).

USDCADDear Friends See the USDCAD Analysis, and also you can choose Martingale Strategy for select the Buy & sell orders & also Follow my Trading View Channel to get the Instant Notification of Every New Analysis.

USD CAD Expecting reversal after few green one'sRed line plotted describes trend line resistance at higher timeframe. Blue square describes resistance at 4hr timeframe. Expecting false breakout then reversal.
I'll be looking for candlestick pattern or Higher support level break for the entry.

USDCAD MULTI TIME FRAME ANALYSISHello traders , here is the full multi time frame analysis for this pair, let me know in the comment section below if you have any questions , the entry will be taken only if all rules of the strategies will be satisfied. wait for more price action to develop before taking any position. I suggest you keep this pair on your watchlist and see if the rules of your strategy are satisfied.
🧠💡 Share your unique analysis, thoughts, and ideas in the comments section below. I'm excited to hear your perspective on this pair .
💭🔍 Don't hesitate to comment if you have any questions or queries regarding this analysis.

USDCAD ShortFOREXCOM:USDCAD
Hello traders , here is the full multi time frame analysis for this pair, let me know in the comment section below if you have any questions, the entry will be taken only if all rules of the strategies will be satisfied. wait for more Smart Money to develop before taking any position . I suggest you keep this pair on your watchlist and see if the rules of your strategy are satisfied...
Keep trading
Hustle hard
Markets can be Unpredictable, research before trading.
Disclaimer: This trade idea is based on Smart money concept and is for informational purposes only. Trading involves risks; seek professional advice before making any financial decisions. Informational only!!!!

USD/CAD Expecting small period uptrend due to support indicationLets understand what I am trying to to here. There was a horizontal support which helped to move price up. Now if ita takes support cosidering trendline support as well then we can expect a short time upside move

USDCAD TRADE IDEApossible USDCAD trade scenario enter with ltf confirmation if taken direct entry manage your risk properly 1:2-3 RR as this week is full of HIGH IMPACT NEWS enter at your own risk
indicator based SMC approach. follow and like for more such setups
Q&M pettern created so it is bullishIt is created Q&M pettern and 4 hourrs cancle dominant breakout it will down side

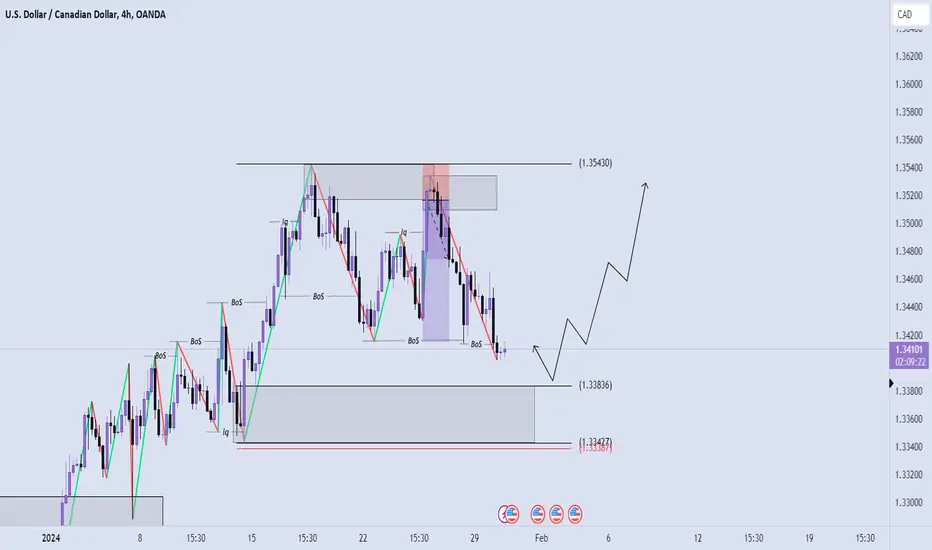
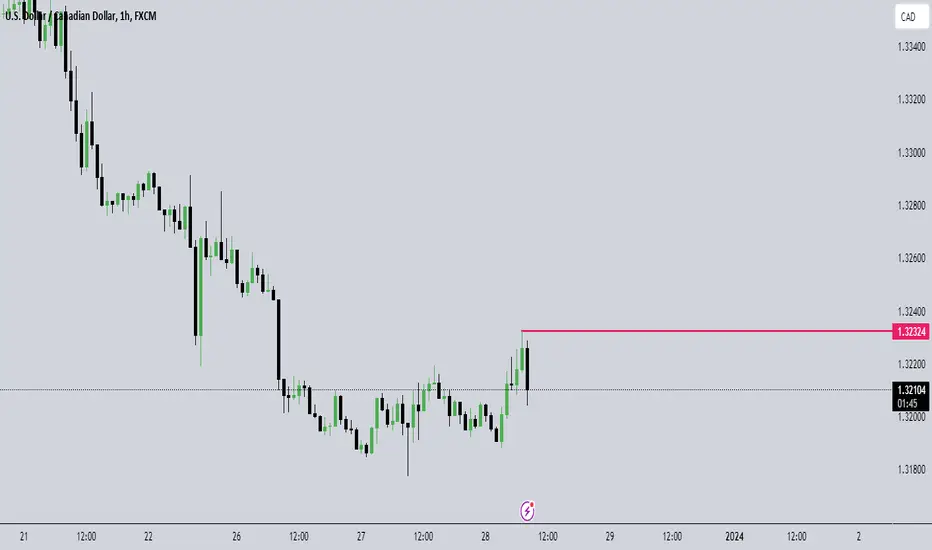
USDCAD Short [Weekly Swing]USDCAD Short Idea based on a Weekly Swing level. Entry refined on the 4H/1H. Confluences on the chart, potential +2.5R.

USD CAD let it pull back to the zone
Disclaimer:- This is not A BUY OR SELL recommendation. please Consult with your financial advisor or with broker before taking any trade,
this post is for educational purpose only . warning :- do not jump directly or do not copy my trades
DO your analysis properly

USDCAD jumps to one-month high ahead of Canada inflationUSDCAD rises for the fourth consecutive day while poking the 200-SMA as the pair traders await Canadian inflation data, namely the Consumer Price Index (CPI) and the Bank of Canada (BoC) CPI. It’s worth noting that the firmer RSI (14) line and the bullish MACD signals favor the latest bull run. Adding strength to the upside bias is the daily closing beyond the previous resistance line stretched from early November. However, the RSI line is approaching the overbought territory and hence suggests a limited upside room for the quote. As a result, the 200-SMA level of 1.3480 appears a tough nut to crack for the Loonie pair buyers, a break of which will open doors for the quote’s quick run-up toward the previous monthly high of around 1.3620.
Meanwhile, the USDCAD pair’s pullback remains elusive unless the quote stays beyond the resistance-turned-support line of around 1.3400. Should the Loonie pair remain bearish past 1.3400 and gain support from upbeat Canada inflation data, its further declines toward the 78.6% Fibonacci retracement of the July-November upside, near 1.3260, followed by the previous monthly low of around 1.3180, can’t be ruled out. It’s worth noting, however, that the year 2023 low marked in July near 1.3090 and the 1.3000 psychological magnet appears as the last defense of the pair buyers.
Overall, the USDCAD pair secures its place on the bull’s radar ahead of the key Canada data.


usd/cad trend change (seLL)usd cad sell below 1.33170 and get a 50 pips target on 1.327 wait for levels

usdcad buybuy trade for usd cad as it on major support buy usd cad wit approx.m5000 pips profit and sl is below support 1.325

USD/CAD Big Belt on Buy PatternThe USD/CAD chart is exhibiting a compelling technical pattern known as the "big belt on buy." This pattern is characterized by a prominent and sustained bullish trend, resembling a significant upward belt on the price chart.
Key Features:
Strong Bullish Momentum: The chart displays a robust and sustained upward movement, indicating a prevailing bullish sentiment in the market.
Consistent Buying Pressure: Buyers have been consistently dominating the market, leading to a series of higher highs and higher lows.
Clear Breakout: The pattern may be accompanied by a clear breakout from a key resistance level, signaling a potential acceleration in the upward momentum.
Volume Confirmation: Analyzing trading volumes can provide additional confirmation. An increase in trading volume during the bullish phases reinforces the strength of the pattern.
Supportive Indicators: Complementing the chart analysis with relevant technical indicators, such as moving averages or RSI, can offer further insights into the sustainability of the bullish trend.
Trading Strategy:
Traders may consider initiating long positions or reinforcing existing ones, aligning with the prevailing uptrend. Setting stop-loss orders and identifying potential profit-taking levels are crucial elements in managing risk and maximizing potential gains.

Clear Buy SideBuy Side Confirmed with MSS formation And a strong inefficiency candle may go good with the CAD news today announcement will come with favor of buy side in USDCAD may end the sell trend

short idea in usd/cadit is in a down trend
its recent price behaviour suggest
after a one big move upward it starts consolidating and make range which eventually gives breakdown towards downside

USDCAD Bullish Kangaroo Tail Signals Potential Upside Amid CPI D📈 Trade Idea Overview:
The USDCAD pair presents an intriguing opportunity with the emergence of a Bullish Kangaroo Tail candlestick pattern, suggesting a potential reversal in the current downtrend. This formation, characterized by a long lower wick and a small body, indicates a rejection of lower prices and a possible shift in market sentiment.
📊 Technical Analysis:
Bullish Kangaroo Tail: The recent candlestick pattern near key support levels on the USDCAD chart signals bullish momentum. Traders may consider this as a buying opportunity.
Fibonacci Confluence: The Bullish Kangaroo Tail aligns with significant Fibonacci retracement levels, reinforcing the potential for a bullish reversal.
📆 Upcoming Catalyst:
Market participants should keep an eye on the upcoming Consumer Price Index (CPI) data release, as it can act as a catalyst for increased volatility. Positive CPI figures may further support the bullish bias, while negative results could pose a challenge to the anticipated reversal.
🎯 Potential Targets:
Short-term: Target the recent swing high as a conservative profit target.
Medium-term: Aim for higher resistance levels, considering the broader trend reversal.
🛑 Risk Management:
Implement proper risk management strategies, including setting stop-loss orders based on technical levels and market conditions.
🚨 Caution:
Trading involves risk, and it's essential to stay informed about economic events and adapt your strategy accordingly. Always use proper risk management to protect your capital.
📈📉 Disclaimer:
This is not financial advice. Traders should conduct their own research and consider their risk tolerance before making any trading decisions.

Waiting For Buy Confirmation to enter TradeHere need to wait 1H candle close above 1.34034 for buy Side Confirmation after confirmation can enter buy trade on Retracement
