USDCAD SELL SETUP📉 USDCAD Sell Setup – Liquidity Sweep + Fractal Shift
Pair: USDCAD
Type: Sell Trade
Entry Bias: Short-term retracement after liquidity sweep
---
🔎 Higher Timeframe Context (Daily)
Daily timeframe is still bullish overall.
But recently, price swept daily liquidity highs and started showing weakness.
This often signals that buyers may be exhausting, and a retracement phase can begin.
---
⏳ 4H Timeframe Confirmation
On the 4H chart, structure has shifted bearish.
Clear signs of weakness after the liquidity grab.
Market is likely setting up for a retracement leg, targeting liquidity below.
A clean fractal shift into bearish order flow confirms downside bias.
---
🎯 Trade Plan
Entry Bias: Sell after confirmation of retracement continuation.
Stop Loss (SL): 1.38570 (above recent liquidity grab).
Take Profit Targets:
1. TP1: 1.37400 (first liquidity sweep zone).
2. TP2: 1.36670 (major liquidity pool below).
---
📌 Summary
USDCAD is bullish on the daily, but after a liquidity sweep, momentum is shifting.
With a bearish 4H structure and fractal shift, probability favors a retracement move down before bulls re-enter.
Bias: Short-term Sell
Risk Management: Always use stops & partials.
---
⚡ This setup is based on liquidity sweeps, fractal shifts, and multi-timeframe confluence — trade safe!
USDCAD trade ideas

Bearish Still Valid with Dual TPsThe Sell signal was already triggerred on Wednesday 27th August with the hope that it will hit the TP1 area which is at 1.3683.
Offcourse, it retraced without hitting the required TP which is still indicating the validation of TP 1.
Now the price is availalbe at extremely discount level. A ride with Bearish from here @1.3825 will lower the risk for us and giving us another opportunity to ride on bears.
I usually take two positions, each 1% risk. both has same SL @1.3929.
Move SL to Break even if TP1 hit and let position 2 head towards TP2 with 0 risk.
Signal:
Position No. 1 (1:1 Risk to Reward)
Entry price: 1.3825
SL: 1.3929
TP: 1.3683
Position No. 2 (1:2 Risk to reward and then 0:2 Risk to reward if after hitting TP1.
Entry price: 1.3825
SL: 1.3929
TP: 1.3561

USD/CAD(20250908)Today's AnalysisMarket News:
Non-farm payroll growth fell significantly short of expectations, with June's data revised downward to negative territory, marking the first contraction since 2020. The unemployment rate hit a nearly four-year high.
Technical Analysis:
Today's buy/sell levels:
1.3812
Support and resistance levels:
1.3909
1.3873
1.3850
1.3775
1.3752
1.3715
Trading Strategy:
If the price breaks above 1.3850, consider a buy entry, with the first target at 1.3873.
If the price breaks below 1.3812, consider a sell entry, with the first target at 1.3775

USD/CAD(20250912)Today's AnalysisMarket News:
U.S. initial jobless claims surged to 263,000 in the week ending September 6, reaching a near four-year high. Traders are fully pricing in three Federal Reserve interest rate cuts by the end of 2025.
Technical Analysis:
Today's Buy/Sell Levels:
1.3848
Support and Resistance Levels:
1.3911
1.3887
1.3872
1.3824
1.3809
1.3785
Trading Strategy:
If the price breaks above 1.3848, consider entering a buy position, with the first target at 1.3872.
If the price breaks below 1.3824, consider entering a sell position, with the first target at 1.3809.

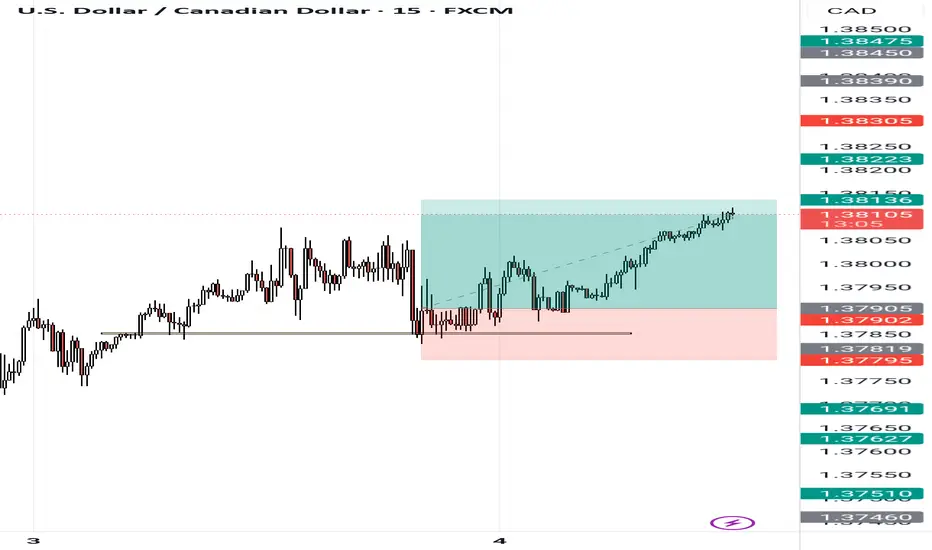
BreakOut Retest Strategy Price came back to a fresh supply zone.
First candle went bullish, second candle (50% wick / 50% body) showed rejection + sellers entering.
You entered sell after confirmation.
Stop above zone, TP far below → 1:8 RR achieved.
Key: fresh zone + rejection + patience → high probability trade.
USD/CAD(20250905)Today's AnalysisMarket News:
① Waller: I believe we should cut interest rates at the next meeting. Multiple rate cuts are possible in the future, but the exact pace depends on the data.
② Musallem: Current interest rates are appropriate, but there are risks in the job market.
③ Bostic: Concerned about inflation, I still believe one rate cut this year is appropriate.
④ The Federal Reserve will hold a payments innovation conference on October 21st, which will discuss stablecoins, artificial intelligence, and tokenization.
⑤ Fed Governor nominee Milan: If confirmed, I will maintain the independence of the FOMC.
⑥ Kashkari: There is room for a modest rate cut.
⑦ The Federal Reserve Beige Book: Economic activity is roughly flat, with businesses and households feeling the impact of tariffs.
Technical Analysis:
Today's Buy/Sell Levels:
1.3791
Support and Resistance Levels:
1.3824
1.3812
1.3804
1.3778
1.3770
1.3757
Trading Strategy:
If the price breaks above 1.3804, consider entering a buy position, with the first target price at 1.3824.
If the price breaks below 1.3791, consider entering a sell position, with the first target price at 1.3778

USD/CAD - longStep-by-Step Breakdown
Liquidity Sweep: The price drops sharply below a recent low, triggering stop-losses from traders who were buying at higher levels. This move is often called a "liquidity sweep": big players intentionally push prices below support to collect liquidity from retail traders.
Order Block: After the sweep, price quickly reverses and enters a highlighted zone (Order Block), where large buy orders likely came into play. This zone represents a price area where institutions or smart money accumulated positions, causing a shift in momentum. Look to enter trades when price retests this zone, expecting the order block to act as support.
Change of Character (ChoCh): The chart marks a "Change of Character" when price breaks above the last lower high, switching the market structure from bearish to bullish. This structural shift signals increasing buyer control, suggesting the market may continue higher.
Liquidity Target: The top yellow box is labeled "Liquidity" and sits above previous highs. This area is important because many stop-losses from short sellers and buy stop orders are likely placed there, making it a natural price target if the uptrend continues.
Trading Logic: The setup combines the sweep (liquidity grab), order block confirmation, and bullish structure shift, aiming for price to move toward the liquidity pool above. Traders could enter a long position after seeing these signals, with stop-loss below the order block and take-profit at the upper liquidity zone.
Why This Works: These methods are popular because they follow institutional logic: markets often move to collect liquidity before trending, and price respects zones where large orders have been placed. Confirmation from structure change and volume helps reduce risk and improves trade quality.

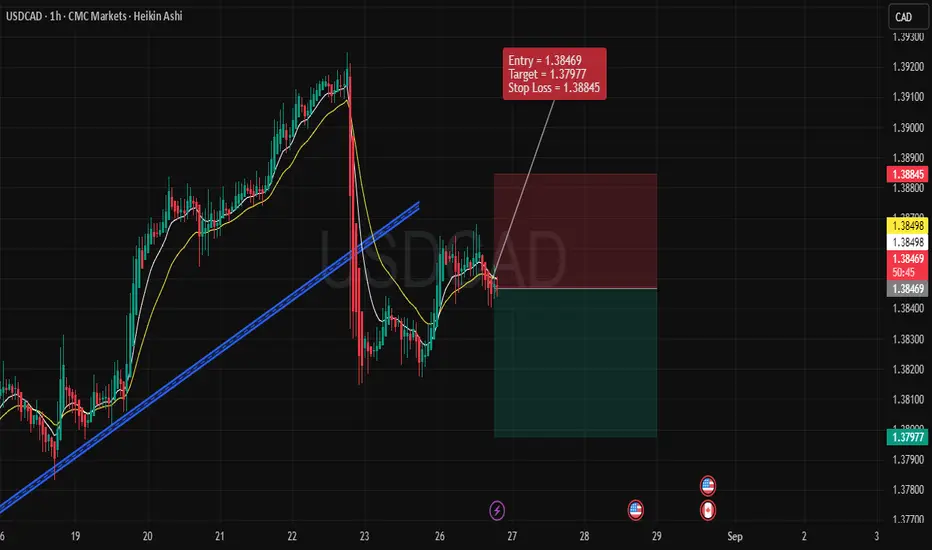
USDCAD – Bearish Trade Setup (1H Timeframe)Trade Details
Entry: 1.38469
Stop Loss: 1.38845
Target: 1.37977
🔹 Technical Reasons for Bearish Bias
Trendline Breakdown
Price recently broke below the rising trendline, indicating that the bullish momentum has weakened.
The failed retest of the broken trendline confirms bearish pressure.
Moving Averages Confirmation
The short-term moving averages (yellow lines) have crossed to the downside, aligning with bearish sentiment.
Price is trading below these moving averages, signaling sellers are in control.
Lower High Formation
After the sharp drop, the latest pullback failed to make a new higher high.
This indicates a shift from bullish structure to a bearish lower-high pattern.
Weak Recovery Attempt
The rebound after the drop is shallow and lacks strong bullish candles.
This suggests the market is unable to regain bullish momentum.
🔹 Risk Management
The Stop Loss is placed above the recent swing high (1.38845), protecting against sudden spikes.
The Target is set at 1.37977, aligning with recent support levels and offering a favorable risk-to-reward ratio.
🔹 Trade Outlook
This setup anticipates continuation of the bearish trend after the trendline break. Unless price reclaims and sustains above 1.3885, sellers remain favored in the short term. A successful breakdown could open the way for deeper downside in USDCAD.
✅ Summary:
Bearish structure confirmed by trendline break, bearish moving average alignment, and weak recovery → Entered short at 1.38469, targeting 1.37977 with stop at 1.38845.
USDCAD LongPrice broke out of a consolidation zone on the daily timeframe and retested and rejected the consolidation zone. On the 1hour timeframe, price created an orderblock. Price then had a break of structure and also created a FVG. Price retested the orderblock and the FVG. I entered long with the stoploss at 1.37680 and the Takeprofit at 1.37990.

Buy Trade - USD/CADGreetings to everyone!
You can place a buy trade on USD/CAD and check out my chart for the ideal entry, stop-loss & target placement.
Remember :-
* Move your SL to breakeven once the trade reaches 1:1 R.
* Aim for a minimum reward of 1:1.5 R.
* Don't risk more than 3% of your total margin.
Let's execute this trade smartly! 🚀
💬 About Me:
I am a professional trader with over four years of experience in the markets. I focus on swing trading using the 4H timeframe, mainly in the forex space. The trades I share here are the actual positions I’m executing. I post them as a small gesture to give back to the trading community that’s been a big part of my journey.
Cheers! 🙏

USDCAD/LOONIE ANALYSIS 06-AUG-2025 @ 1.3750LTP: 1.3750
Resistances: 1.3812/1.3880
Supports: 1.3589/1.3555/1.3537
As long as the resistances hold, we can see 1.3710-1.3660.
Further 1.3621-1.3570m 1.3537, 1.3500-1.3450, 1.3375

USDCADStructure has shifted on USDCAD — price broke the previous high and formed a new Higher High (HH), confirming a bullish trend.
I’ll be watching to see if price pulls back into the 4H Supply Zone, potentially offering a rejection and a drop lower. From there, I’ll shift focus to the Demand Zone below, where I’ll be looking for long setups if price gives clear bullish confirmation.

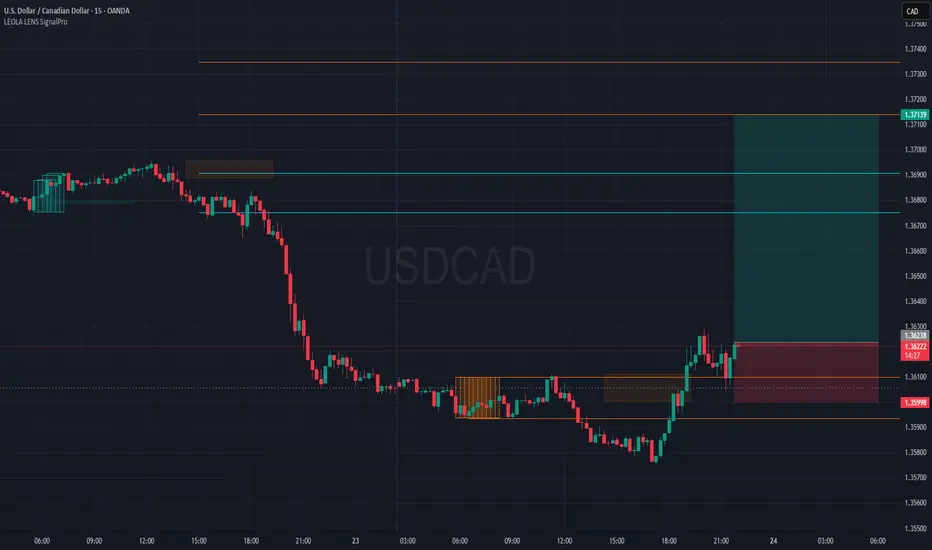
USDCAD Bullish Setup-Shift from Accumulation to ExpansionPrice has broken above recent accumulation range marked by Liquidity Control Boxes.
SignalPro long setup activated with:
🔶 Smart accumulation zone breakout
🔁 Minor retest at 1.361 area holding
🎯 Targeting upper liquidity levels around 1.37139
Price structure shows a bullish microtrend reversal with risk capped below last demand block.
Key Elements on Chart:
📦 Leola Lens SignalPro's control zones provided context for consolidation and breakout
📈 Breakout aims toward untested supply zones above
⏳ Timeframe: 15-min
🧠 Educational Use Only – No financial advice.
Tool used: Leola Lens SignalPro
USDCAD ShortPrice is currently in a downtrend on the daily timeframe. Price is retracing and retesting an 1 hour orderblock and a 30min orderblock. price is rejecting the orderblock and should continue to the downside. Take profit is at 1.35910 and stoploss is at 1.36410

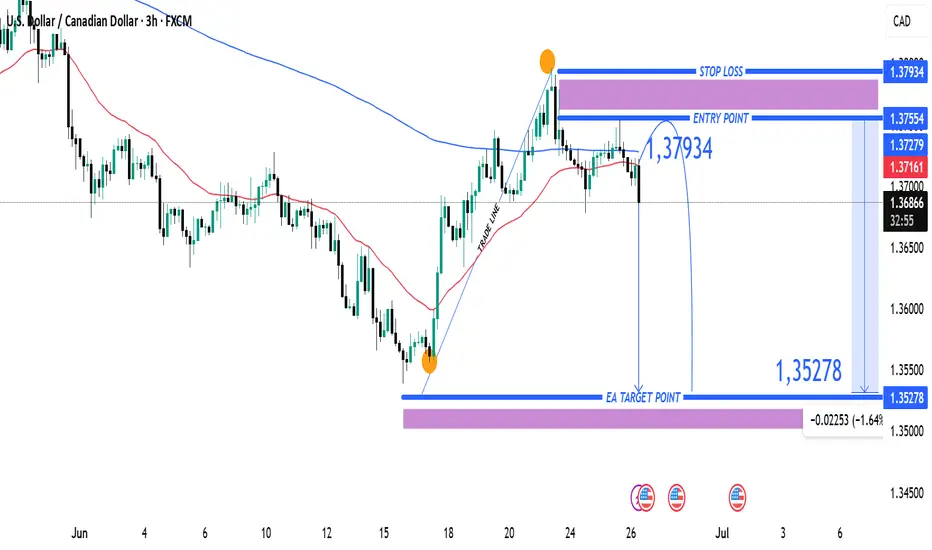
USDCAD Bearish Reversal Trade Setup – 3H Chart Analysis (June 26 Entry Zone: 1.37279 – 1.37554
🔹 Stop Loss: 1.37934
🔹 Target: 1.35278
🔹 Risk-to-Reward (RR): ~1:2.5
🧠 Technical Breakdown
Trend Overview:
Overall trend shows a downtrend from earlier June, followed by a corrective bullish move.
Price failed to sustain above the 200 EMA (blue line), indicating continued bearish pressure.
Trade Line Break:
A steep bullish trendline was broken, signaling a potential trend reversal or deeper pullback.
Bearish Rejection Zone:
The purple zone (1.37279 – 1.37554) acted as resistance.
Price formed a lower high and rejected this zone, confirming selling interest.
Entry Strategy:
Short entry is ideally within or just below the rejection zone.
Aggressive entry already in play at current market price (1.36909) after confirmation.
Target Zone:
Projected towards 1.35278, aligning with previous support and fib retracement zone.
Large purple support zone near the target suggests a potential reversal area.
⚠️ Risk Notes
Be cautious of USD volatility due to upcoming economic events (noted with icons on the chart).
Stop loss above previous swing high minimizes risk of fakeouts.
✅ Summary:
This is a bearish swing setup aiming for a significant drop toward 1.35278. The clean rejection from resistance and trendline break supports a high-probability short opportunity with favorable risk-reward.
USDCAD SELL
📉 Trade Plan (Bearish Bias – USDCAD)
🔍 HTF (High Time Frame – 4H / Daily):
Trend: Clearly bearish
Structure: Lower highs, lower lows
Current Price Action:
Price tapped into a key HTF POI (e.g., Supply Zone, OB, or FVG)
📊 1H Time Frame:
Price tapped into HTF POI
Shows weak bullish reaction or possible reversal signs
This is your watch zone to drop into LTF

USDCAD - IS A BULLISH TREND REVERSAL BREWING?Symbol - USDCAD
USDCAD is staging a recovery supported by the recent strength in the US dollar. A potential return to the prior demand zone could reinforce the bullish case for the pair and present an opportunity to establish long positions.
Amid the backdrop of dollar strength, the market appears to be transitioning into a new phase. The pair has ceased making lower lows and is now forming an EQL structure, from which it is attempting to break out of the prevailing downtrend. While the initial liquidity retest may lead to a brief correction, a swift rebound and sustained consolidation above this level would confirm the emergence of a bullish market structure.
Resistance levels: 1.3700, 1.3730
Support levels: 1.3660, 1.3648
Despite the recent breakout above descending resistance, selling pressure remains evident, with sellers likely to re-enter near the 1.3686 level. A clear breakout above this area, followed by a shift in market sentiment and consolidation above the 1.3675–1.3686 zone, would validate bullish intent and signal readiness for a broader recovery.

USDCAD (4H) Technical Analysis Long setupPair: USD/CAD
Timeframe: 4H
Bias: Bullish
Structure: Falling Wedge Breakout → Bullish Continuation
Current Price: ~1.3937
📐 Chart Breakdown
1. Falling Wedge Formation (Bullish Reversal Pattern)
Price was consolidating inside a falling wedge, typically a bullish reversal structure.
Breakout to the upside confirms buyer strength after a period of compression.
2. Breakout + Retest Setup
Clean breakout above the wedge has occurred.
Price is currently forming a small bullish flag (or consolidation), likely preparing for a retest of the breakout zone around 1.3856 before continuation.
3. Clean Bullish Imbalance Above
The large bullish candle created imbalance above, increasing the probability of a liquidity-driven move up.
4. Higher Timeframe Target Zones (Key Supply)
1st Target: 1.4150 (previous support turned resistance)
2nd Target: 1.4280 (major horizontal resistance)
Final Target: 1.4520 (multi-week supply zone)
🧾 Trade Plan – Long Setup
Entry Zone Stop Loss Take Profit Targets Risk:Reward
1.3860–1.3885 (retest of wedge) 1.3750 (below last swing low) 1.4150, 1.4280, 1.4520 1:3 to 1:5+
✅ Confluences Supporting the Long Bias
Confluence Details
✅ Falling Wedge Pattern Price broke out from bullish wedge.
✅ Retest Setup Pullback expected before continuation.
✅ Bullish Market Structure Higher highs forming post-breakout.
✅ Clean Liquidity Above Fewer obstacles on the way to major targets.
✅ Strong Demand Zone Below Buyers stepped in around 1.3750–1.3850.
🚫 Invalidation
If price breaks below 1.3750, bullish setup fails.
Close below wedge base may invite deeper bearish pressure.
📊 Trade Management Tips
Enter on bullish candle at retest zone.
Scale out profits at 1.4150, then 1.4280, let partials run to 1.4520.
Use trailing SL after price hits first TP for a risk-free runner.

USDCAD ANALYSIS Usd cad is bullish wait for retracement to buy. minor or major retracement needed atleast 50% for long position.

USDCAD - SUPPORT UNDER PRESSURE, WILL THE DOWNTREND CONTINUE?Symbol - USDCAD
CMP - 1.3803
USDCAD continues to test the support within its established trading range amidst a broader global downtrend. While the currency pair remains confined within this range, the pressure on the support persists. The market’s response to false breakouts appears to be weakening, and the price action continues to challenge the 1.3780 level, thereby increasing the likelihood of a further decline.
The US Dollar is showing signs of retreating from resistance and is beginning to decline, exerting a corresponding effect on USDCAD. Should the currency pair breach the 1.3780 level and establish a sustained close below it, this could signal the continuation of the prevailing trend following a consolidation phase.
Resistance Levels: 1.3810, 1.3830
Support Levels: 1.3780, 1.3740
The primary focus remains on the lower boundary of the trading range at 1.3780, The role of this range is to provide consolidation amidst a broader downtrend. Therefore, a decisive breakout below support would likely trigger the initiation of the distribution phase.

USDCAD - April EndAll time frames are downtrend.
But this is at strong support which made W - Close above support by rejecting it.
D- Strong bullish engulf candle to go up.
BOS happened.
Sideways is going on. let it break and go up. or wait for some magic candle at
4H or D candle.

USDCADHey trader, in today's trading session we are monitoring USDCAD for a selling opportunity around 1.3900 & 1.3840 TREND IS YOUR FRIEND.
