USDCAD DAILY TECHNICAL ANALYSIS Trading Ideas-
Long positions above 1.3198 with targets at 1.3806 & 1.3976
Alternative scenario
If price goes down 1.3198 look for 1.2954 & 1.2735 as targets.
Supports and resistances
1.2954 & 1.2735
1.3806 & 1.3976
Trade ideas

USDCAD bears brace for mid-1.3200s with eyes on BOC’s MacklemUSDCAD remains depressed at the lowest levels in six weeks after breaking the 100-DMA as broad US Dollar weakness joins firmer oil prices. Even so, the bears are waiting for the Bank of Canada (BOC) Governor Tiff Macklem’s speech for further directions. That said, the 50% Fibonacci retracement level of June-October upside, near 1.3250, appears the immediate support ahead of an upward-sloping support line from June 2022, close to the 1.3200 round figure. Should the Loonie pair drops below 1.3200, the 200-DMA support level of 1.3150 could act as the last defense of the pair buyers.
On the contrary, the 100-DMA hurdle surrounding 1.3480 challenges the short-term recovery moves of the USDCAD pair. Following that, a run-up towards the previous monthly peak of around 1.3700 can’t be ruled out. It’s worth noting, however, that multiple resistances around 1.3800 and 1.3850 could challenge the pair buyers past 1.3700, a break of which could propel prices towards the year 2022 top of 1.3977.
Overall, USDCAD is well-set on the bear’s radar despite the latest hesitance in refreshing the multi-day low.

My Elliotical Approach to USDCAD Long.The chart mentions everything pretty clearly. My next approach would be to look for an entry point close to the channel's lower trendline with the protective stop (invalidation level) at wave 1 high. This is the 5th wave of the 3rd wave as per my analysis which we would attempt to capture. The target should be close to the channel's upper trendline. A definitive target will come into existence once the correction is completed. Happy Trading!

USDCAD Trade IdeaUSDCAD Trade Idea-
Price is entering in a highly bullish zone. a possible target is 250 pips.

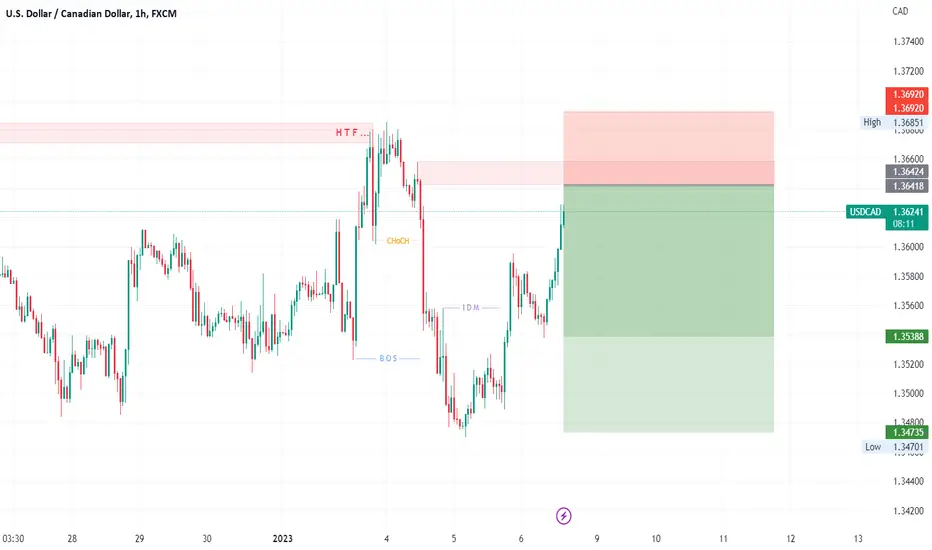
USDCAD FORECASTHey guys this is just forecast not confirm trade.
I am expecting it will fall from our zone.
Lets see what will happen next.
Thanks
Elliott Wave in technical analysis1st wave done, 2nd wave triple corr wave, now running in 3rd wave.


USDCAD is likely to decline further as 2023 beginsUSDCAD holds onto the late December downside break of the seven-week-old ascending support line, even if the 200-SMA challenges the bears. That said, the downbeat MACD and RSI conditions also favor the Loonie pair sellers as they attack the key SMA surrounding 1.3520. Additionally challenging the bears is the double bottoms marked around 1.3485-80 during the last week, a break of which could quickly drag prices towards the previous monthly low of around 1.3380. In a case where the quote remains bearish past 1.3380, November’s low of 1.3225 will gain the market’s attention.
On the contrary, recovery moves need to cross the previous support line from early November, close to 1.3645-50 by the press time, to convince buyers. Even so, the double tops marked the last month at around 1.3700 will be a crucial challenge for the USDCAD optimists. It's worth noting that the pair’s run-up beyond 1.3700 won’t hesitate to challenge the yearly high marked in October around 1.3980. However, November’s peak near 1.3810 could act as a buffer during the anticipated run-up.
Overall, USDCAD is likely to remain weak but the 200-SMA can challenge short-term sellers amid the holiday mood.


USDCAD Long Bias AnalysisHey traders, here is the analysis for the USDCAD. If you guys like my analysis please hit like👍 and follow. Thanks. DISCLAIMER:- This is not financial advice.

USDCAD DAILY TECHNICAL ANALYSIS Trading Ideas-
Long positions above 1.3198 with targets at 1.3806 & 1.3976
Alternative scenario
If price goes down 1.3198 look for 1.2954 & 1.2736 as targets.
Supports and resistances
1.2954 & 1.2736
1.3806 & 1.3976

USDCAD Ascendric Triangle Wait for proper breakout or breakdown Yellow are Suppply zone aand blue are demand zone

Ascending triangle teases USDCAD bears ahead of BOC inflationUSDCAD portrays a bearish triangle formation after multiple rejections from the 1.3700 threshold. The sellers, however, await a clear downside break of the stated formation’s support, near 1.3590 by the press time, as well as the Bank of Canada inflation data. A clear break of the stated 1.3590 support, backed by upbeat BOC CPI, could quickly drag the quote to the 200-SMA level surrounding 1.3490-85. Following that, the 23.6% Fibonacci retracement level of the pair’s October-November fall, near 1.3400, could act as an intermediate halt during the south run aiming the theoretical target of 1.3270. In a case where the Loonie pair remains depressed below 1.3270, the previous monthly low, close to 1.3235, will gain the market’s attention.
Alternatively, USDCAD needs a successful clearance of the 1.3700 hurdle, as well as softer Canada inflation, to defy the bearish chart formation. In that case, the previous monthly top and 78.6% Fibonacci retracement level around 1.3810 will be in the spotlight. Should the Loonie pair remains firmer past 1.3810, the 1.3900 round figure and November’s high near 1.3975 could entertain buyers before highlighting the 1.4000 psychological magnet.
Overall, USDCAD bears are ready for entry as traders await the key data from Canada.

99% for a long trade. #USDCADAs per my analysis #usdcad will go for a long position. i am waiting for one more confirmation to enter a long trade.

USD/CAD DAILY ANALYSIS LONG BREAKOUTUSDCAD Has Been Given Trend line Breakout and Retest its Previous Support Which is draw in Chart .
Look For Buying opportunities Above 1.35772 and sustain above 1 hour candle ..
Long Stop loss = 70 pips
Selling Below 1.35221
Stop loss 70 pips

USDCAD Sell trade opportunitiesUSDCAD Sell trade opportunities
its overall sell trade is retracing from the major Resistance line and currently breakout short-term support it is a good opportunity to short trade here with good risk rewards

USDCAD has more upside to track but 1.3700 is the key hurdleUSDCAD grabbed the bull’s attention ever since it crossed a two-month-old descending resistance line, now support around 1.3500. The upside bias also takes clues from the firmer RSI and MACD. However, the 61.8% Fibonacci retracement level of the pair’s October-November downside, near 1.3695, appears a tough nut to crack for buyers. Also acting as an upside filter is the monthly high of 1.3700, a break of which could quickly propel the quote towards November’s peak surrounding 1.3805. It’s worth noting that the Loonie pair’s run-up beyond 1.3805 could aim for October’s high near 1.3980, as well as the 1.4000 psychological magnet.
Meanwhile, the 50% Fibonacci retracement level near 1.3600 restricts the USDCAD pair’s short-term downside ahead of highlighting the 1.3500 support confluence including the resistance-turned-support line from October and the 38.2% Fibonacci retracement level. Even if the pair declines below 1.3500, a convergence of 100-SMA and 200-SMA at 1.3485 appears strong support.
Overall, USDCAD is likely to rise further but the 1.3700 resistance challenges the bulls.

USDCAD Sell Curently usdcd given breakout so this trade is very dangerous for short but I am in Short BIAS from that Supply Zone

Usdcad short possible USDCAD SELL 1.35829
SL 1.37100
TP 1.32272
Trade based on pure price action levels open a sell trade and thanks Manpritfx later

USDCAD DAILY TECHNICAL ANALYSIS Trading Ideas-
Long positions above 1.3198 with targets at 1.3806 & 1.3976
Alternative scenario
If price goes down 1.3198 look for 1.2954 & 1.2735 as targets.
Supports and resistances
1.2954 & 1.2735
1.3806 & 1.3976

USDCAD signals further run-up towards 1.3800 ahead of BOCA clear upside break of the 50-DMA and a descending trend line from October’s peak keeps USDCAD bulls hopeful ahead of the Bank of Canada’s (BOC) interest rate hike announcement. That said, the Loonie pair’s upside towards the previous monthly top surrounding 1.3800 appears imminent. However, multiple hurdles near 1.3850 could challenge the quote’s additional north-run, a break of which will direct the buyers towards the yearly high marked in October surrounding 1.3980.
Alternatively, USDCAD pullback remains elusive unless the quote remains beyond the 50-DMA level near 1.3565. Also testing the bears is the aforementioned resistance line from October 13, now support near 1.3550. It’s worth noting that the three-week-old ascending support line, close to 1.3430, acts as an additional downside filter for the Loonie pair before directing the bears towards the 1.3230-25 horizontal support comprising July’s high and November’s low.
Overall, the USDCAD pair has already flashed a bullish signal before the BOC’s widely anticipated rate hike.

USDCAD Buy trade opportunitiesUSDCAD Buy trade opportunities
Its Overall Bullish trend its recently broken the resistance level and close above with good Bullish candle here is good opportunity to take a buy trade with good risk rewards

