USD/CAD Bullish Breakout: Trade Hits Target Successfully200 EMA (Blue) at 1.43070: Represents long-term trend resistance.
30 EMA (Red) at 1.42660: Represents short-term trend direction.
Price has strongly surged above the 30 EMA, indicating bullish momentum.
Support and Resistance Levels:
Support Zone (Red area at the bottom): Marked near 1.42150, where the price reversed.
Target Resistance (Blue at the top) at 1.43672: Marking the expected profit zone.
Trade Setup:
Entry Point: Near the support zone at 1.42451-1.42660.
Stop Loss: Placed below 1.42150, to minimize risk.
Target Point: 1.43672, aligning with a previous resistance level.
Price Movement: A strong bullish breakout occurred, moving rapidly toward the target.
Trade Analysis:
✅ Successful Long Trade: Price moved sharply upward after consolidating at support.
📈 Momentum Confirmation: The strong bullish candles indicate aggressive buying.
🎯 Target Achieved: The trade reached the projected 1.43672 level, generating a solid risk-to-reward outcome.
Potential Future Outlook:
If the price sustains above 1.43672, further upside could be seen toward 1.44000.
If it faces resistance, a pullback toward 1.43070 (200 EMA) may occur before another move.
Trade ideas

USDCAD EA MAN UPDATE >READ THE CHAPTIANKey Observations:
Support Zone & Trendline: The price is currently pulling back to a support zone, aligning with the ascending trendline, which may provide a bullish reaction.
EMA Confluence: The price is positioned above the 30 EMA (1.43193, red) and approaching the 200 EMA (1.43167, blue), indicating strengthening bullish momentum.
Target Point: If the price holds at the support and resumes its uptrend, the next target is around 1.43803 - 1.43689.
A break and close above the recent high could confirm further bullish movement towards the target zone. However, if the support fails, a deeper retracement may occu

"USD/CAD: Uptrend Resilience After Consolidation - Strategic Lon
### *"USD/CAD: Uptrend Resilience After Consolidation - Strategic Long Position Planning"*
---
#### 🔍 **Trend Analysis and Current Situation**
From the USD/CAD daily chart, we observe the following:
1. **Main Trend (Trend Analysis):**
- The price is currently trading above the **BB 104 0.1 (Upper)** at approximately **1.4210**, indicating a clear **Uptrend**.
- **SMA 104** shows a steep upward slope, confirming the long-term bullish momentum.
2. **Key Support Levels:**
- The first support level is at **Lower Band 1 (LB1)** of **BB 20 1** around **1.4301**.
- The second support level is the **BB 104 0.1 (Lower)** at approximately **1.4167**.
3. **Key Resistance Levels:**
- The first resistance level is at **Upper Band 1 (UB1)** of **BB 20 1** around **1.4380**.
- The next resistance is the previous high at **1.4500**.
4. **Price Behavior (Price Action):**
- After a strong rally, the price is currently consolidating but maintaining key support levels.
- There are signs of buying pressure returning, though resistance in the upper zone remains significant.
---
#### 📝 **Trading Plan**
1. **Long Entry Point:**
- Enter a Long position when the price holds firmly above **LB1 (1.4301)** with clear buying momentum.
- Use **Position Sizing of 2/3 (66.67%)** since the primary trend remains bullish.
2. **Scaling In:**
- If the price retraces to the **BB 104 0.1 (Lower)** at **1.4167** and holds steady, consider adding **1/3 (33.33%)** to the position.
3. **Stop Loss:**
- Place the Stop Loss at **BB 104 0.1 (Lower)** at **1.4167** if the price closes significantly below this level.
4. **Take Profit:**
- First target at the **UB1 (1.4380)** resistance.
- Next target at the previous high around **1.4500**.
---
#### 💡 **Risk Management Strategy**
- Focus on **Long positions** as the primary trend is upward.
- Be cautious of potential volatility during consolidation phases.
- Adjust **Position Sizing** according to the main trend to minimize risk from short-term pullbacks.
---
#### ✨ **Conclusion**
USD/CAD remains in an uptrend despite recent consolidation. Planning a well-structured Long position at strategic support levels with sound risk management can capitalize on the bullish momentum while maintaining strong downside protection.
---

USD/CAD After Liquidity Purge on Buy SideUsd/Cad after liquidity purge on Buy side. Go short according to the chart/

USDCAD SELL ON FIRE.......📉 USDCAD: Bearish Move Incoming?
The USDCAD pair is showing signs of weakness, suggesting a potential downside move. Here’s why sellers might take control:
🔹 Strong Canadian Dollar (CAD): Rising oil prices are boosting the Canadian dollar, as Canada’s economy is closely tied to crude oil exports.
🔹 Weaker US Dollar (USD): The US dollar is facing pressure due to dovish signals from the Federal Reserve and softer economic data.
🔹 Technical Breakdown: USDCAD is approaching a key support level. A break below could trigger further downside momentum.
🔹 Market Sentiment: Risk appetite in global markets is favoring commodity-linked currencies like CAD, adding to the selling pressure on USDCAD.

usdcad short📉 USDCAD Short Trade Alert! 🚀
🔻 I’m taking a SELL position on USDCAD based on strong supply & demand analysis. Here’s why:
✅ Key Resistance Zone: Price has reached a major supply zone, showing signs of rejection.
📉 Bearish Confirmation: Price action indicates a potential reversal with clear rejection wicks.
📊 Fundamental Factors: USD weakness + CAD strength aligning with my analysis.
🎯 Target Levels: Aiming for key demand zones with proper risk management in place.
🔔 Trade Smart! This is not financial advice—just my perspective based on price action. Always do your own research! 📊💰
#USDCAD #ForexTrading #SupplyAndDemand #ForexSignals #TradeSetup #PriceAction 🚀

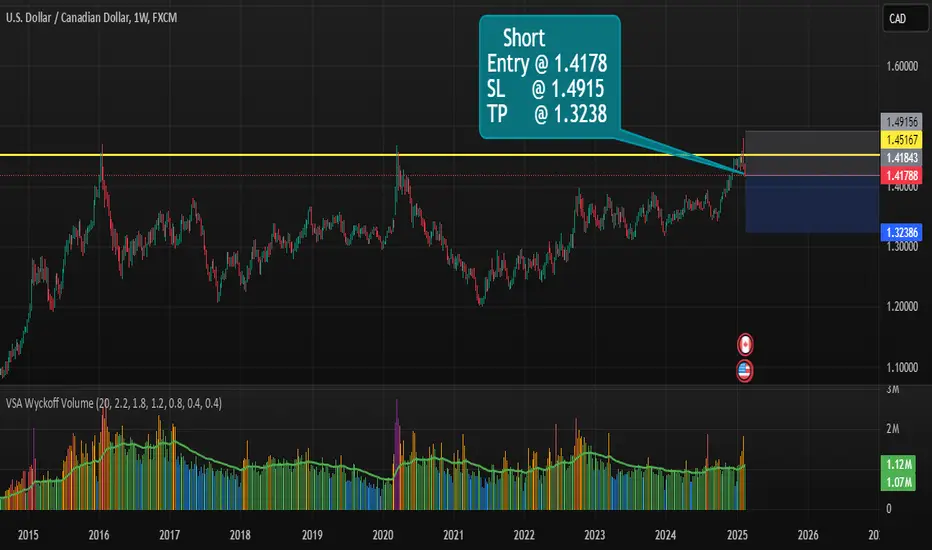
USDCAD Short Set up....📉 USDCAD Short Trade Setup
🔹 Entry: 1.4178
🔹 Stop-Loss (SL): 1.4915
🔹 Take-Profit (TP): 1.3238
USDCAD has reached a strong resistance zone, previously tested in 2016 and 2020. Price is showing signs of rejection, making this a potential short opportunity.
🎯 Trade Plan:
- Short from 1.4178
- Stop above recent highs at 1.4915
- Targeting a move towards 1.3238
📊 Volume Analysis:
Wyckoff volume suggests potential weakness at resistance, supporting the short bias.
USDCAD - EXPECTING BREAKDOWN OF CONSOLIDATIONSymbol - USDCAD
The USDCAD pair is currently consolidating within the range of 1.4485 to 1.4280 The US dollar has been experiencing negative momentum recently. However, with the Non-Farm Payroll (NFP) report upcoming, the data could either reinforce the ongoing correction or provide support to the US dollar index. Market attention is focused on today's economic announcements. If the actual NFP results fall below the forecasted 169K, expectations for a Federal Reserve rate cut are likely to strengthen.
Today, The Federal Reserve's monetary policy report will be released, potentially offering further insights into the regulator's future actions. Should the NFP data be weaker than anticipated, the US dollar may depreciate, leading to a potential decline in USDCAD. Conversely, if the data exceeds expectations, the US dollar is expected to strengthen, driving USDCAD higher. In the event that the Federal Reserve signals a potential rate cut, the US dollar could weaken, thereby supporting the Canadian dollar.
Resistance levels: 1.4345, 1.4370
Support level: 1.4280
Given the uncertainty surrounding the upcoming data, it is challenging to predict the precise market outcome. From a technical perspective, the currency pair appears weak due to the falling value of the US dollar. A break below the 1.4280 support level could signal further downside potential.

USDCADUpward Trend and Consolidation: From mid-October to late November, there was a notable upward trend, which then entered a consolidation phase.
Recent Price Action: The recent candlesticks show a mix of green (bullish) and red (bearish) candles, pointing to market indecision.
Potential Reversal: Given the consolidation and trendlines, there's potential for a reversal in the trend.
Support and Resistance Usage: These levels can help identify potential entry and exit points for trades.

USDCAD LONGusdcad now he did break an important area resistant
targeting the monthly and weekly areas

USDCAD_H4- Connection to Oil Prices: The rise in crude oil prices, following the announcement of a decrease in US oil inventories and supply concerns due to new US sanctions on Russia, has strengthened the Canadian Dollar.
- Canada’s Role in the Oil Market: Canada is the largest oil exporter to the United States, and fluctuations in oil prices directly affect the value of the Canadian Dollar.
Outlook
- US Dollar: Lower-than-expected inflation data and the possibility of rate cuts by the Federal Reserve are likely to result in further depreciation of the US Dollar. Upcoming economic reports, such as retail sales and production indices, will play a key role in the next movement of the USD.
- Canadian Dollar: Continued oil price increases and positive economic data could strengthen the Canadian Dollar against the US Dollar. Investors should keep an eye on reports related to Canada’s production and exports.

USDCAD SHOWING A GOOD DOWN MOVE WITH 1:10 RISK REWARD USDCAD SHOWING A GOOD DOWN MOVE WITH 1:10 RISK REWARD
DUE TO THESE REASON
A. its following a rectangle pattern that stocked the market
which preventing the market to move any one direction now it trying to break the strong resistant lable
B. after the break of this rectangle it will boost the market potential for break
C. also its resisting from a strong neckline the neckline also got weeker ald the price is ready to break in the outer region
all of these reason are indicating the same thing its ready for breakout BREAKOUT trading are follws good risk reward
please dont use more than one percentage of your capitalfollow risk reward and tradeing rules
that will help you to to become a bettertrader
thank you

LUCID TRAFFIC SIGNALThe "LUCID TRAFFIC SIGNAL" indicator is designed to provide a clear visual representation of market trends and potential price zones. By analyzing multiple timeframes, it highlights significant levels that can guide traders in identifying bullish, bearish, and neutral market conditions. The indicator uses color-coded lines to mark key price levels for different timeframes, helping traders make more informed decisions with ease.
This tool is ideal for those who want a straightforward, visually appealing way to monitor market dynamics and align their strategies with prevailing trends. Whether you're a day trader or a long-term investor, the "LUCID TRAFFIC SIGNAL" ensures you're equipped to navigate the markets confidently.

USDCAD - Algo Price Delivery The technical rating for the pair is buy today, but don't forget that markets can be very unstable, so don't stop here. According to our 1 week rating the USDCAD shows the buy signal, and 1 month rating is strong buy. See more of USDCAD technicals for a more comprehensive analysis.

USDCAD - SWING TRADE IDEA ON SHORT SIDESymbol - USDCAD
USDCAD is currently trading at 1.4325
I'm seeing a trading opportunity on sell side.
Shorting USDCAD pair at CMP 1.4325
I will add more quantity at 1.4350 & 1.4380, If comes. Holding with SL 1.4420
Targets I'm expecting are 1.4250 - 1.4200 & 1.4155
Disclaimer - Do not consider this as a buy/sell recommendation. I'm sharing my analysis & my trading position. You can track it for educational purposes. Thanks!

USDCAD ORDERFLOW - M15bigger picture, up trend from 1.2005 (2021) is in progress. Next target is 61.8% projection of 1.2401 to 1.3976 from 1.3418 at 1.4391. Medium term outlook will remain bullish as long as 55 W EMA (now at 1.3706) holds, even in case of deep pullback.

USDCAD MULTI TIME FRAME ANALYSISHello traders , here is the full multi time frame analysis for this pair, let me know in the comment section below if you have any questions , the entry will be taken only if all rules of the strategies will be satisfied. wait for more price action to develop before taking any position. I suggest you keep this pair on your watchlist and see if the rules of your strategy are satisfied.
🧠💡 Share your unique analysis, thoughts, and ideas in the comments section below. I'm excited to hear your perspective on this pair .
💭🔍 Don't hesitate to comment if you have any questions or queries regarding this analysis.

CADUSD - Buy We can go for buy in CADUSD in this week. Dollar is currently very strong and I don’t see any support for CAD oil prices are also struggling at the same time. Inflation number for Canada is hawkish however upcoming news for Canada could be dovish.
1. Dollar very strong.
2. Oil price Struggling
3. Upcoming growth numbers (Dovish)

USDCAD - SWING TRADE IDEA ON SHORT SIDESymbol - USDCAD
USDCAD is currently trading at 1.3847
I'm seeing a trading opportunity on sell side.
Shorting USDCAD pair at CMP 1.3847
I will add more quantity at 1.3880, If comes. Holding with SL 1.3910
Targets I'm expecting are 1.3765 - 1.3715 & 1.3662
Disclaimer - Do not consider this as a buy/sell recommendation. I'm sharing my analysis & my trading position. You can track it for educational purposes. Thanks!


USD/CAD Elliottwave I’ve mapped out an Elliott Wave structure for USDCAD on the 2-hour chart. Currently, the pair is progressing through the wave sequence, and I’m anticipating a final push to complete the 5th wave around the 1.4160 level.
🔹 Key Levels to Watch:
Potential retracement zones for waves 3 and 4 are highlighted, which could present good opportunities for those looking to enter or add positions.
This chart is free for everyone—feel free to use it as part of your trading plan! 🙌
If you find value in my analysis and would like to show some gratitude, consider supporting via Your support helps me keep sharing insights like these with the community!
#Forex #ElliottWave #USDCAD #TechnicalAnalysis #Trading

Ucad bearishBearish setup seen as per my perspective.
Risk reward will be good if win 7% if lose 1 %
Ucad distribution phase completing selling at London

USDCAD in last leg up..USDCAD moving up in last 5th move up..
So buyers should be cautious now...
upside resistance : 1.38600 -1.39400
breaking of the channel will bring weakness towards 1.37500+ in form of
corrective waves a-b-c.
