Buy Trade - USD/CHFGreetings to everyone!
Place a buy trade on USD/CHF and check out my chart for the ideal entry, stop-loss & target placement.
Remember :-
* Move your SL to breakeven once the trade reaches 1:1.4 R.
* Aim for a minimum reward of 1:1.5 R.
* Don't risk more than 3% of your total margin.
Let's execute this trade smartly! 🚀
💬 About Me:
I am a professional trader with over four years of experience in the markets. I focus on swing trading using the 4H timeframe, mainly in the forex space. The trades I share here are the actual positions I’m executing. I post them as a small gesture to give back to the trading community that’s been a big part of my journey.
Cheers! 🙏
USDCHFTMSP trade ideas

"USD/CHF Bearish Setup: SBR + DBD Zone Rejection Trade"🔷 Key Zone:
SBR + DBD Zone 📦
Drop-Base-Drop supply zone
Support turned resistance
Strong rejection area
🔵 Entry Point:
📍 0.81519
Right at the resistance zone
EMA (7) also acting as dynamic resistance
❌ Stop Loss:
🔺 0.82231
Above the zone for safety
Covers potential fakeouts
🎯 Target Point (Take Profit):
✅ 0.78500
Clean horizontal support
Strong RR (Reward-to-Risk) ~ 4:1
📉 Potential Move: -294.6 pips (-3.61%)
📊 Indicators & Structure:
📈 EMA (7) is sloping down = bearish pressure
🔽 Clear downtrend into the zone
📦 Supply zone aligns with trend = high confluence
🧠 Smart Trading Tips:
Wait for confirmation (like rejection wicks or bearish engulfing)
Watch out for news (economic calendar icons shown)
Stick to the plan: entry ➡️ SL ➡️ TP

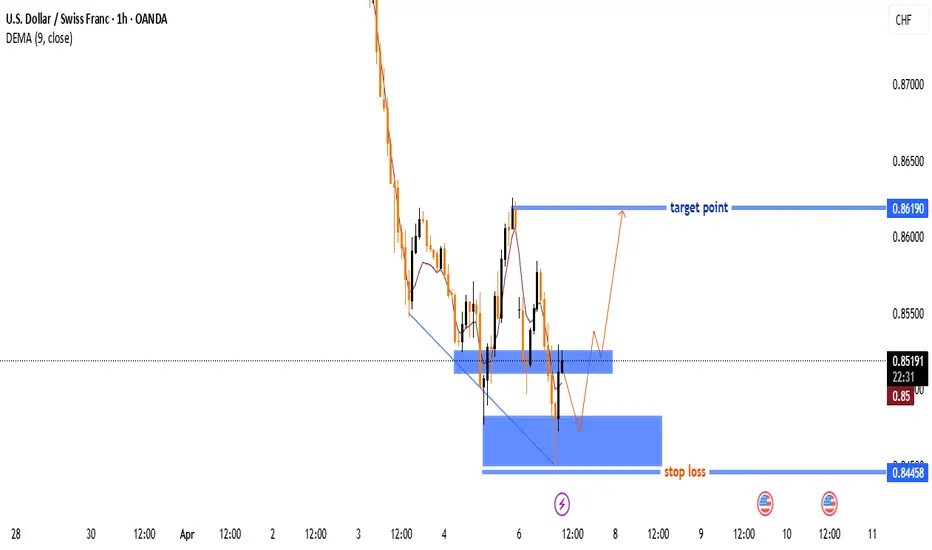
USD/CHF Trade Analysis: Potential Reversal & Bullish Setup🔻 Downtrend Phase: The price has been falling sharply, showing a strong bearish move before hitting support. 📉🔥
🟦 Support Zone (0.84458):
🔵 Key level where buyers may step in. If price holds, it could trigger a reversal. 🚀🔄
🟦 Resistance Zone (Mid-Level):
🟡 A minor barrier before price can continue higher. Expect some reaction here. ⚠️📊
🎯 Target Point (0.86190):
✅ Bullish target where price is expected to move if the support holds. 🎯💰📈
⚠️ Stop Loss (0.84458):
❌ If price breaks below this level, the trade setup is invalidated. 🚨🔻
📊 Trade Setup Summary:
✔️ Buy from support (if confirmed)
✔️ Stop Loss below 0.84458 ❌
✔️ Take Profit at 0.86190 🎯💵
🔥 Risk-Reward looks good! Watch for confirmation before entering! 🚀📊
USDCHF longs or shorts?right now USDCHF is on a neutral path lets wait for break to up or down for further confirmation

USDCHF MULTI TIME FRAME ANALYSISHello traders , here is the full multi time frame analysis for this pair, let me know in the comment section below if you have any questions , the entry will be taken only if all rules of the strategies will be satisfied. wait for more price action to develop before taking any position. I suggest you keep this pair on your watchlist and see if the rules of your strategy are satisfied.
🧠💡 Share your unique analysis, thoughts, and ideas in the comments section below. I'm excited to hear your perspective on this pair .
💭🔍 Don't hesitate to comment if you have any questions or queries regarding this analysis.

USD/CHF 4H Analysis – Key Levels & Trade Setup🔍 Key Observations:
📌 Supply & Demand Zones:
🔴 Upper Supply Zone (~0.9000): 🔥 Strong resistance where sellers might enter.
🟠 Mid Supply Zone (~0.8850): ⚠️ Key resistance where price is testing.
🟢 Lower Demand Zone (~0.8750): ✅ Possible support where buyers could step in.
📊 Price Action:
🔼 Price is currently at 0.88230 📍 near resistance.
🔽 If rejected, it might drop ⬇️ toward 0.86531 🎯.
🔼 If buyers win, it could rise to 0.9000 🚀.
📉 Bearish Bias Expected:
❌ Rejection at 0.8850 → Drop to 0.86531 ⏳.
✅ If it breaks higher, look for 0.9000 🎯.
🔎 Final Thoughts:
⚡️ Watch for reactions at 0.8850 📍.
🔹 Bearish confirmation? Sell ➡️ 0.86531.
🔹 Bullish breakout? Buy ➡️ 0.9000.
🎯 Trade wisely! 💰📉📈

U.CHF UCHF is showing a wide divergence signal on H4. It shows a sign of significant weakening of the downtrend and potential for a strong recovery.
Find long signal buy on M15

07-03 USD CHF BUYDear traders, here are the important pivot support zone of USDCHF (15m), candles taking support at the pivot S2 level it represents short time intraday buy direction,based on previous day movement and market trend.
Entry : 0.87700
Target :0.88200
Stop loss:0.87200
Profit: 50 Pips
Risk Reward Ratio 1:1
Note: Intraday view only

USDCHFFX:USDCHF
Hi Guys, as you can see that USDCHF has given a trendline breakout in 1D Time Frame. we can take a pull back or swing entries for down side and long term view, so plan your trade acordingly...

USDCHF - TECHNICAL STRUCTURE HINTING AT A POSSIBLE DECLINESymbol - USDCHF
The USDCHF pair recently broke its upward trend following a shift in the fundamental backdrop, with the U.S. dollar entering a corrective phase. A potential set-up is forming on the chart that could reinforce this shift. The situation remains complex due to the ongoing tariff dispute initiated by President Trump, with European nations responding in kind, resulting in heightened economic risks. Additionally, after both Trump and Federal Reserve Chairman Jerome Powell hinted at the possibility of rate cuts, the dollar began its corrective movement, which is having a favorable impact on the forex market.
From a technical perspective, the 0.9000 level is of significant importance, as it constitutes a strong zone of support and resistance. Should the bears manage to maintain the price below this level, it would confirm a shift in trend and could trigger a downward movement. USDCHF may decline to 0.8900 - 0.8700 in the medium term perspective.
Key resistance levels: 0.9000, 0.9045, 0.9065
Key support level: 0.8915
While there remains the possibility that the price may revisit the range and test the 0.5 Fibonacci retracement, both technical and fundamental factors suggest a potential decline. Attention should be focused on the 0.9000 level.

USD/CHF After Liquidity sweep during London Kill Zone Dollar versus Swiss Franc after Liquidity sweep during London Kill Zone

USDCHF MULTI TIME FRAME ANALYSISHello traders , here is the full multi time frame analysis for this pair, let me know in the comment section below if you have any questions , the entry will be taken only if all rules of the strategies will be satisfied. wait for more price action to develop before taking any position. I suggest you keep this pair on your watchlist and see if the rules of your strategy are satisfied.
🧠💡 Share your unique analysis, thoughts, and ideas in the comments section below. I'm excited to hear your perspective on this pair .
💭🔍 Don't hesitate to comment if you have any questions or queries regarding this analysis.

USDCHF spot outlook USDCHF spot looks bullish spike possible from 0.9050 to 0.9150.
Any breakout below 0.9050 may hit SL and settle down at low ...
If get raise above 0.9050 chances to hit TGT 0.9150

USDCHF - CONTINUATION OF BULLISH TREND?Symbol - USDCHF
The USDCHF pair is currently entering the realization phase following an extended period of correction. A favorable environment has been established by the ongoing uptrend and the strengthening of the dollar. The technical outlook on the daily timeframe is positive. After breaking through trend resistance, the price retested the previously breached level. Following a false breakout, the pair successfully consolidated above this key point, establishing an interim low and signaling potential for further gains.
From a technical perspective, attention is now focused on the resistance level at 0.9110. Should the bulls manage to surpass this zone and establish a sustained break above it, the pair could potentially rise toward 0.9180–0.9300
Resistance levels: 0.9110
Support levels: 0.9050
Prior to breaking through the resistance, the currency pair may test the support level at 0.9050, driven by liquidity beneath this area. However, a decisive move above 0.9110 could serve as the catalyst for further upward momentum.

USDCHF MULTI TIME FRAME ANALYSISHello traders , here is the full multi time frame analysis for this pair, let me know in the comment section below if you have any questions , the entry will be taken only if all rules of the strategies will be satisfied. wait for more price action to develop before taking any position. I suggest you keep this pair on your watchlist and see if the rules of your strategy are satisfied.
🧠💡 Share your unique analysis, thoughts, and ideas in the comments section below. I'm excited to hear your perspective on this pair .
💭🔍 Don't hesitate to comment if you have any questions or queries regarding this analysis.

Usdchf trend chiftUSDCHF 4H trend shifted to sell side now market in imbalance area entry sell risk 45 pips reward 180 pips 1:4 ratio

USD/CHF Poised for a Bullish Breakout: Path to Parity Bullish Scenario 🚀📈
1. Breakout Above the EMA (200) 🔺:
If the price closes above the 200-week EMA (0.9082), it could confirm a long-term bullish trend reversal.
A strong push may target key levels like 0.9500 and eventually 1.0000 (parity) 🎯, as shown by the projection arrow.
2. RSI Support 💪:
The RSI above 50 indicates that buyers are gaining momentum.
If RSI trends toward 70, it signals even stronger bullish momentum ✅📊.
3. Higher Highs and Higher Lows 📶:
The chart is forming higher highs and higher lows, a classic signal of an uptrend.
This pattern supports a move toward higher price levels 🚀.
🔥 Key Takeaway: A breakout above the EMA could spark a powerful rally, with parity (1.0000) as a major psychological target.

USDCHF 4h ideaAfter a bullish engulfing candle pattern and the pair braking through the descending trend line, my trade idea is that it is possible that for a short term, the pair will push higher towards the major supply zone around 0.9100. On the Daily chart, the pair is indicating a trend reversal, but conservative long entries are still valid.

USDCHFThis chart depicts the USD/CHF currency pair on a daily (1D) timeframe. It's showing a notable upward trend, demonstrated by the purple dashed lines that form a channel holding the price movement. Trading volume currently sits at 86.98K.
Current Price: 0.90735 (with a high of 0.90800, low of 0.90308)
Stochastic Oscillator: Blue line at 34.36, and orange line at 24.40, suggesting current momentum.
Timeframe: Trends tracked from July to February 2025.
In essence, the overall analysis suggests a bullish trend with reasonable momentum

USDCHF MULTI TIME FRAME ANALYSISHello traders , here is the full multi time frame analysis for this pair, let me know in the comment section below if you have any questions , the entry will be taken only if all rules of the strategies will be satisfied. wait for more price action to develop before taking any position. I suggest you keep this pair on your watchlist and see if the rules of your strategy are satisfied.
🧠💡 Share your unique analysis, thoughts, and ideas in the comments section below. I'm excited to hear your perspective on this pair .
💭🔍 Don't hesitate to comment if you have any questions or queries regarding this analysis.

USDCHF_H4USD/CHF Currency Pair Analysis:
From a technical perspective, USD/CHF on the 4-hour time frame, after multiple BOS (Break of Structure) formations, has now created a CHOCH (Change of Character) and broken the last low of the uptrend to the downside. Currently, with the decline of the moving averages on the ALLIGATOR indicator, there is a possibility of a price decrease.
Overall, this scenario is strengthened by the condition that USD/CHF, unless a 4-hour candle close occurs above the Fair Value Gap (FVG) in the range of 0.9090-0.9067, could potentially decline towards the FVG in the range of 0.8949-0.8937.

USDCHF MULTI TIME FRAME ANALYSIS🧠💡 Share your unique analysis, thoughts, and ideas in the comments section below.I'm excited to hear your perspective on this pair .
💭🔍 Don't hesitate to comment if you have any questions or queries regarding this analysis.

USDCHF BUY REGION🎯 USDCHF Buy Opportunity Alert! 💹
The market is nearing a strong buy region for USDCHF! 📈
Keep an eye on the price action and set your strategy.
This could be your next big trading move! 💰
📊 Pro Tip: Always manage your risk and stay updated with market trends.
💡 Share your thoughts in the comments – what’s your target for USDCHF?
