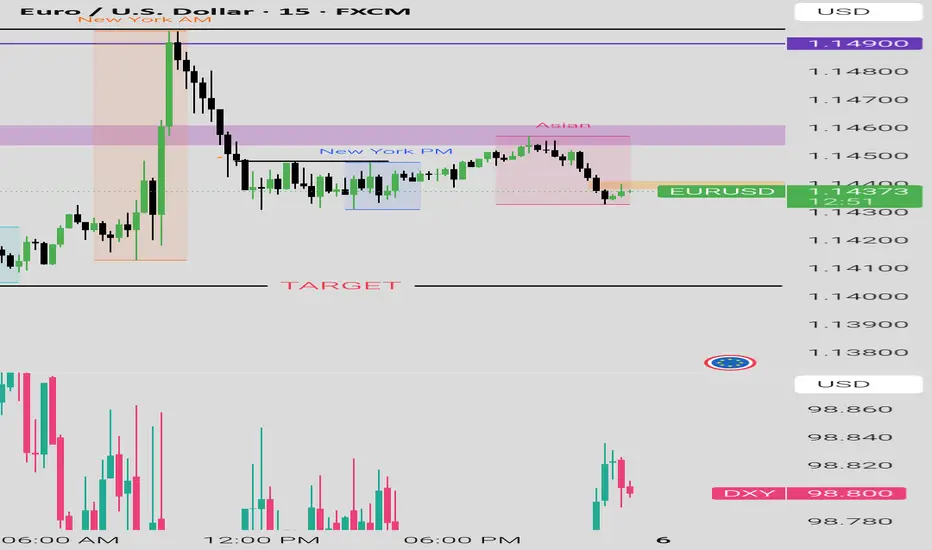
EUR USD 15 ANALYSIS AND TARGETAS market have taken all buyside liquiduty it is goignt for sell side....i have marked the todays target .....for more updates follow me
USDEUR trade ideas

EURUSD – Strong uptrend, Non-farm could trigger breakoutEURUSD continues to maintain a steady uptrend within a well-defined ascending channel. Each pullback has been well absorbed around the EMA 34–89 and the dynamic support zone near 1.13650, signaling that buyers remain in control.
Currently, price is approaching the key resistance area around 1.14840 – a level that previously triggered a rejection. If it fails to break through again, a minor pullback toward the support zone followed by a bounce, as shown in the chart, is a likely scenario.
What’s worth noting is that the Non-Farm Payroll report is due later today – a potential catalyst that could either fuel a breakout or break the current channel. If U.S. job data comes in weaker than expected, the USD may face selling pressure, providing a strong boost for the euro.

Eurusd 15 min targetAs eurusd has taken it's all buyside liquidity it's likely to go down.... Keep following for more updates
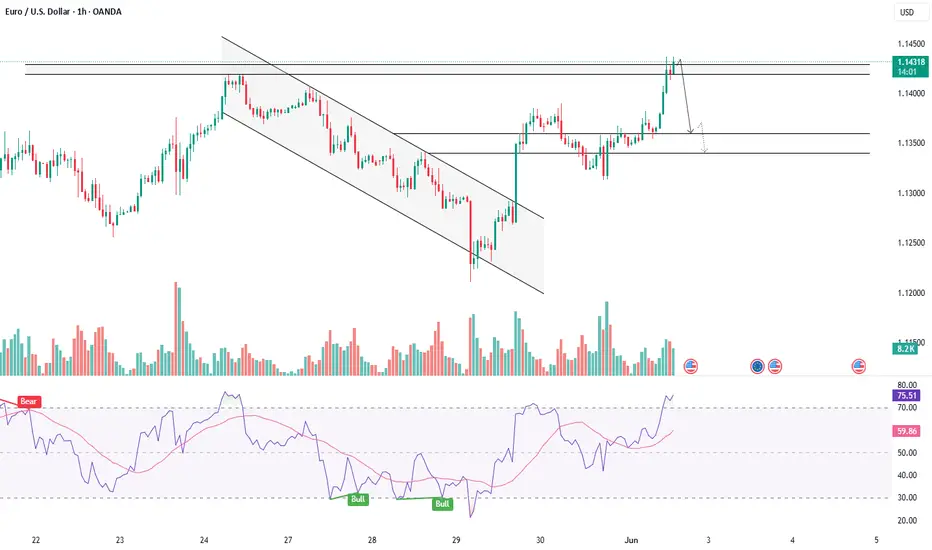
EURUSD – Lower highs emerging, bearish signal in sight?Although the lower-than-expected jobless claims forecast could support a mild USD recovery, EURUSD is still holding above the EMAs in the short term. However, signs of weakness have begun to appear as price continues to get rejected around the 1.14800 zone – which aligns with a descending trendline that has been tested multiple times.
Currently, EURUSD is forming a lower high pattern on the H4 chart, indicating growing selling pressure. If this pattern continues and price breaks below the 1.13800 area, a deeper correction toward the 1.13600 support zone could be triggered. This level has repeatedly supported price in the past and coincides with the confluence of the 34 and 89 EMAs.

EURUSD – Strong push but might run out of steamEURUSD has just bounced nicely off the 1.13400 support zone. Price is now climbing back toward the previous high around 1.14500 – which looks promising, but also comes with some risk. This is a level that previously triggered a strong reversal, so if price fails to break through again, a pullback toward the lower EMA region is quite possible.
On the chart, I can see price approaching the upper boundary of the ascending channel, while buying momentum seems to be fading. If we see a reversal candlestick pattern or long upper wicks forming in this area, it might be an early sign of a short-term drop.
What about the news? The latest JOLTS report shows job openings in the US are slowing down, raising concerns about the labor market. At the same time, US–China trade tensions are flaring up again, and President Trump's unclear remarks on tariffs are making investors more cautious with the USD.

EURUSDPrice action trading is a methodology in financial markets where traders make decisions based on the actual price movements of an asset over time, rather than relying heavily on technical indicators or fundamental analysis. It involves observing and interpreting patterns and trends in price charts to predict future price movements.

EURUSD – In a tough spot as USD regains momentumThe sharp rise in ADP and ISM PMI forecasts is shifting market expectations: the Fed is now less likely to cut interest rates soon. This immediately supports the USD recovery and puts pressure on major currency pairs – EURUSD included.
Looking at the H4 chart, we can see price being rejected around the 1.14480 resistance zone, right when the EMA 34 and 89 lines are starting to tighten – a sign that the bullish momentum is fading. At this point, price appears to be heading back toward the 1.13300 support zone, which has held several times before. If this level breaks, the bearish move could extend toward 1.12890.

EUR/USD Breakout Above 1.1417 | Target: 1.1488EUR/USD 1D Chart – Analysis:
Price is consolidating near 1.1417 after a bullish breakout above the descending trendline. It’s trading above key EMAs with strong support at 1.1375–1.1312 zone. RSI around 56 suggests moderate bullish momentum.
Key Support: 1.1375 / 1.1312
Resistance: 1.1488
Outlook: Bullish bias above 1.1375. Break above 1.1417 can push price toward 1.1488.

EURUSD - FALSE BREAKOUT MAY TRIGGER CORRECTIONSymbol - EURUSD
CMP - 1.1431
EURUSD is appreciating amid a weakening US dollar. However, the pair is facing significant resistance and exhibiting signs of a false breakout, which may precede a corrective movement.
EURUSD is currently testing a key resistance zone within a distribution phase and displaying characteristics of a potential false breakout. While the broader market structure remains bullish - evidenced by the pair breaching local resistance and establishing new highs. The failure to sustain upward momentum and the price consolidating below the 1.1418 level may act as a catalyst for a correction. Concurrently, the US dollar is approaching a support level and may initiate a rebound, exerting downward pressure on EURUSD.
Resistance levels: 1.1440, 1.1424, 1.1418
Support levels: 1.1384, 1.1343
Should the currency pair fail to establish a firm position above 1.1424 during the ongoing resistance retest, the likelihood of a downward consolidation increases, potentially presenting an opportunity for short positioning. The anticipated correction could extend toward the identified support zones before the broader uptrend resumes.
Bullish Idea for EURUSD with Confluence strategyIf EURUSD corrects till the demand zone marked which is Fib retracement of 0.618 after trend line breakout and if given a proper confirmation candle at the zone there is chance for possible bullish trade.

FXHUNTER / EURUSDHello, I'm FXHUNTER. Analysis of the EURUSD symbol. This symbol is in an uptrend and is expected to be supported by the order block area I identified.

EUR/USD4H Bearish Trade Setup Supply Zone Rejection with 3:1 RRR🔷 Trend Overview
📈 Price was in a rising channel (trend line + support line).
❌ Channel broken on downside → potential trend reversal.
🟧 🔼 Supply Zone (Sell Area)
📍 Zone: 1.13707 – 1.14432
🟠 Price faced rejection here.
💡 Institutional selling likely in this zone.
🔥 This is the ideal short-entry area.
🟦 🔽 Entry Point
🎯 Entry: Around 1.13694
🧩 Sits just below supply zone = safer trigger.
✅ Wait for a bearish confirmation candle before entering.
🟨 Support Level
📉 Support Zone: ~1.13100 – 1.13400
📊 Recently broken with a strong bearish candle.
🧱 Used to act as a floor, now may act as resistance.
🟩 🎯 Target Point
✅ Take Profit: 1.10970
📎 Matches previous structure support.
💰 Lock in profits before the psychological level at 1.1100.
🟥 ⛔ Stop Loss
❌ Stop: 1.14419
📏 Placed above the supply zone for protection.
🛡️ Shields from false breakouts or spikes.
⚖️ Risk-to-Reward Ratio (RRR)
💡 Approx. 3:1 ✅
📉 Risk: ~70 pips
📈 Reward: ~270 pips
🔥 High-probability setup
📌 EMA (Exponential Moving Average – 70)
📍 EMA 70 at 1.13102
🔻 Price is below the EMA → favors bearish momentum
🧠 Pro Tips:
🔍 Watch for bearish engulfing or rejection candles at the entry zone.
🗓️ Be aware of major news events (ECB, Fed).
🧮 Adjust lot size for risk management (based on SL size).
✅ Summary:
🧩 Element 📊 Value
Trade Type 🔻 Short (Sell)
Entry Point 📌 1.13694
Stop Loss ⛔ 1.14419
Take Profit 🎯 1.10970
RRR ⚖️ ~3:1
Sentiment 📉 Bearish

Sales position in EURUSDAccording to the generated signals, a sell position in the EURUSD currency pair has been activated until the target is reached.

EUR/USD 4H Chart Analysis – May 29, 2025🔍 Market Structure Overview
Current Price: 1.12753
Key Zone: Price is hovering at a critical resistance-turned-support area.
🧱 Key Levels
Resistance Zone: 1.15639 (🔝 Main Target)
Support Zone: 1.10736 (🔻 Main Target)
Intermediate Zones:
Target One (Bullish): 1.14139 📈
Target One (Bearish): 1.11687 📉
🔄 Scenario Outlook
📈 Bullish Scenario:
If price holds above the 1.1275 zone, we could see a climb towards:
1.14139 (minor target)
1.15639 (major resistance & final target)
🚀 Breakout above could indicate continuation of higher highs.
📉 Bearish Scenario:
Failure to hold above 1.1275 could push price lower:
First support at 1.11687
Final drop towards 1.10736 support zone
🪓 Breakdown could confirm lower low structure.
🧠 Conclusion
This is a decision point zone. Wait for confirmation before jumping in. A strong bullish or bearish candle at this level will dictate the next move. Risk management is key here! 🎯

EUR/USD – Potential Short-Term TradeTime Frame: 1H
Bias: Long (Bullish Reversal Expected)
Setup Type: Reversal from Flip Zone
Date: May 27, 2025
🔍 Market Context:
The price is currently retracing after forming a short-term lower high.
It has entered a prior demand zone (highlighted box) that acted as resistance-turned-support — a classic flip zone.
The market has shown responsiveness to this zone in the past (bounces seen on May 22–23 and again on May 24), suggesting strong buyer interest remains here.
📌 Key Levels:
Interest Zone for Longs: 1.1300 – 1.1320
This is where buyers are expected to step in again. Look for bullish price action confirmation in this zone before entry.
Entry Trigger: Bullish engulfing, strong wick rejection, or bullish divergence within the demand zone.
Target Zone: 1.1424
A clean 90-pip move (approx. 0.90%) from the entry zone — aligns with the previous high and liquidity pool.
Stop Loss: Below 1.1300 (e.g., 1.1288)
To protect against deeper sweeps of the zone.
Risk-Reward: ~1:5
Excellent R:R if price reacts cleanly from the flip zone.
📈 Trade Idea Summary:
Buy EUR/USD around 1.130–1.132
Stop Loss: 1.1288
Take Profit: 1.1424
R:R Ratio: ~1:4.8
Confirmation Needed: Bullish candlestick pattern or rejection wick in the zone.
⚠️ Notes:
If price slices cleanly through 1.1300 without wicks or slowing down, invalidate the setup — wait for a deeper retest or a fresh demand zone to form.
⚠️ Disclaimer
This post is purely for educational purposes. I am not a financial advisor, and nothing here should be taken as financial advice. Always consult your financial advisor before making any investment or trading decisions. Or at the very least, consult your cat. 🐱

EURUSD MULTI TIME FRAME ANALYSISHello traders , here is the full multi time frame analysis for this pair, let me know in the comment section below if you have any questions , the entry will be taken only if all rules of the strategies will be satisfied. wait for more price action to develop before taking any position. I suggest you keep this pair on your watchlist and see if the rules of your strategy are satisfied.
🧠💡 Share your unique analysis, thoughts, and ideas in the comments section below. I'm excited to hear your perspective on this pair .
💭🔍 Don't hesitate to comment if you have any questions or queries regarding this analysis.

EUR/USD (4H chart) Technical analysisTechnical analysis for EUR/USD (4H chart) based on your screenshot:
🧠 Chart Analysis:
🔍 Price Action & EMAs:
Price has rejected the 1.1400+ zone and is now pulling back.
It is currently sitting just above the 50 EMA (green) but below the 200 EMA (red) — indicating possible weakness.
Support zone: ~1.1270–1.1280 (EMA cluster + prior structure)
Resistance zone: 1.1350–1.1380
📉 RSI Analysis:
RSI trending downward, around 40–45, showing bearish momentum building.
No bullish divergence yet.
📌 Trade Ideas:
🔻 Bearish Bias (preferred short-term outlook):
Entry: Below 1.1280
Target 1: 1.1220
Target 2: 1.1170
SL: Above 1.1350
🔼 Bullish Scenario (if price holds and bounces above 50 EMA):
Entry: On strong bullish candle above 1.1350
Target 1: 1.1400
Target 2: 1.1460
SL: Below 1.1270
⚖️ Bias Summary:
Short-term bearish below 1.1280
Neutral to bullish only above 1.1350

EURUSD selling view on 15 min We can see a good move to downside :-
1. resistance on 15 min
2. buyers trap
3.pullback to downside

EUR USD Weekly Free Analysis (25-05-25 to 31-05-25)This week, the U.S. Dollar (USD) shows minor strength (+0.10%) but faces resistance near 1.15000–1.16000. Support lies at 1.07000–1.08000. A break above 1.15000 could target 1.16000, while failure may retest 1.07000. Watch 4H trends for confirmation.
(Free analysis based on limited data—verify with volume & news.)

ICT HUNTER EURUSDHello, I'm FXHUNTER. Welcome to my channel. Analysis of the EURUSD symbol. This symbol is in an upward trend. The demand area that I identified in the 3h timeframe has caused the previous ceiling to become BOS, so it has a lot of validity. If the price reaches this area, we can enter a buy trade by forming a choch in the lower timeframe.

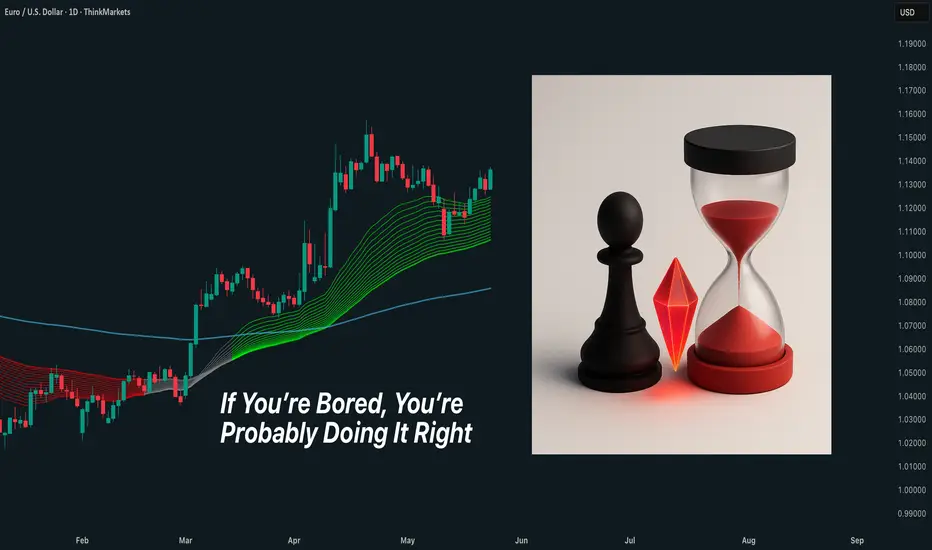
If You’re Bored, You’re Probably Doing It RightYou think trading should be exciting?
That every day should feel like a high-stakes chess match?
That if it doesn’t feel intense, something’s wrong?
Nope.
Good trading is boring.
Systematic.
Repetitive.
Unemotional.
You take your setup. You size properly. You respect your stops. You move on.
Same rules. Same routine. Same process.
It’s not sexy. But it’s stable.
The truth?
The more exciting your trading feels, the more likely you’re slipping.
Overleveraging. Overtrading. Overreacting.
Boredom isn’t a bug. It’s a feature.
It means you’re not chasing.
You’re not forcing.
You’re following your edge — and letting the numbers do the heavy lifting.
You don’t need adrenaline.
You need consistency.
Get comfortable with boredom. That’s where the money is.
Boredom is not your enemy — it’s your ally.
Stay patient, stay consistent.
Charts & Grit
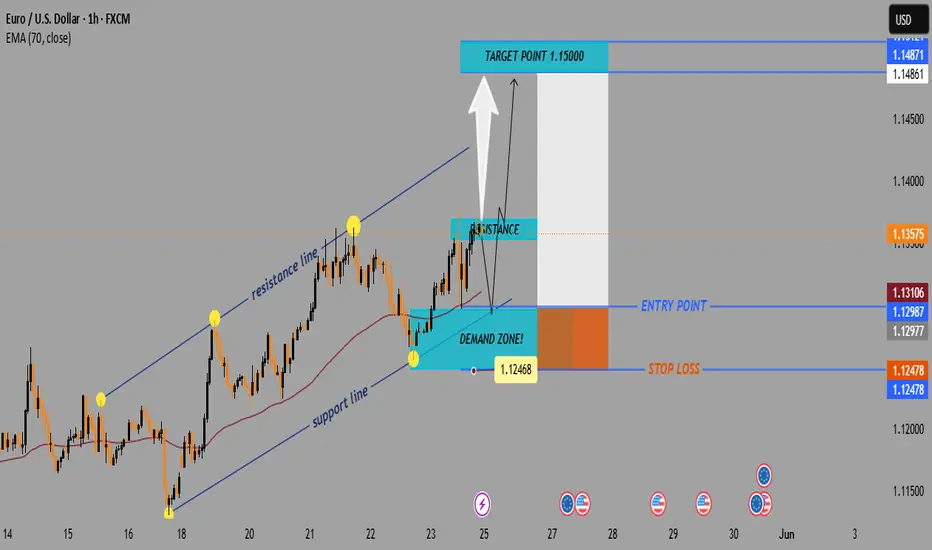
EUR/USD Bullish Trade Setup – Demand Zone to 1.15000 TargetTrend Overview:
↗️ Uptrend Channel
Support Line (Bottom of channel): Holding the upward price movement.
Resistance Line (Top of channel): Price touches and retraces — a key watch level.
Key Zones:
🟦 Demand Zone (BUY Area)
🟢 1.12468 – 1.12987
Strong support.
Price may bounce from here if retested.
Buyers likely to activate here.
🟥 Resistance Zone
🔴 Around 1.13575
Price faces selling pressure.
If broken, could signal a bullish continuation.
Entry & Exit Strategy:
🎯 Target Point: 1.15000 (Marked in blue above)
🚀 Bullish Target
Above the resistance, indicating breakout potential.
📍 Entry Point: 1.12987 – 1.13106
Slightly above the demand zone.
🛑 Stop Loss: 1.12478
Just below the demand zone for risk control.
EMA (70) Line:
📈 Currently at 1.13106
Price is trading above the EMA = bullish signal.
Scenario Summary:
Bullish Setup
✅ Wait for a pullback into the demand zone
✅ Enter near the blue entry area
✅ Target the 1.15000 zone
✅ Risk managed by stop-loss just below demand zone
EUR USD Weekly analysis (25-05-25 to 31-05-25)Key EUR/USD Levels (4H Chart)
Rejection Zone (Resistance): 1.1400 – 1.1450
Major Supply Zone: 1.1470 – 1.1500
Support Zone: 1.1250 – 1.1204
Target Demand Zone: 1.0980 – 1.0950
🌍 Fundamental Backdrop (as of May 25, 2025)
USD Strength
The Fed remains hawkish, with inflation still sticky above 2%.
Markets are pricing in delayed rate cuts, supporting the USD.
Eurozone Weakness
Slower growth across major Eurozone economies (especially Germany).
ECB is more dovish — already signaling possible rate cuts by Q3.
Bond Yield Divergence
US yields are staying elevated vs. falling EU bond yields — this widens the interest rate differential in favor of USD.
Risk Sentiment
Global markets are shifting toward risk-off due to geopolitical tensions and US-China tech war news — again favoring safe-haven USD.
