EURUSD next breakout moveEUR/USD Intraday Analysis – Key Zones to Watch
The market structure for EUR/USD on the 15-minute chart presents a well-defined range with key trading zones.
🔸 Sell Zone – The price is currently trading near this zone, indicating potential short opportunities if bearish pressure increases.
🔸 Buy Zone – A key support level where buying interest may emerge, leading to possible bullish movements.
🔸 Target & Stop Levels:
Buy TP and Sell SL: Upper resistance level where buying targets align and sell stop-losses are triggered.
Sell TP and Buy SL: Lower support level acting as a sell target and buy stop-loss zone.
Traders should monitor price action around these zones for confirmations before entering trades.
📅 Date: March 25, 2025
📊 Chart: 15-Minute (EUR/USD)
💹 Broker: FXCM
USDEUR trade ideas

EURUSD SELL OPTION
NEWS :
U.S. Dollar Strength: The U.S. dollar has strengthened to a three-week high against the euro, bolstered by robust U.S. services data and a more cautious stance from President Donald Trump on imposing new tariffs. This has alleviated some fears of an economic slowdown and contributed to the dollar's appreciation.
Technical Indicators: The EUR/USD pair has broken below the 1.0800 support level, reaching three-week lows. This decline suggests potential for further downside movement
Resistance Levels (Sell Zone)
1.0925 - 1.0950 → Major resistance (Double Top Formation)
1.0860 - 1.0885 → Key resistance (Previous swing high)
1.0820 - 1.0800 → Intraday resistance (Breakout Level)
🔻 Support Levels (Buy Zone)
1.0720 - 1.0700 → First support (Recent low)
1.0650 - 1.0630 → Strong support (Fib 61.8% retracement)
1.0590 - 1.0560 → Major support (Critical demand zone)
🔴 Sell Trade Setup:
Entry Point: 1.0800 - 1.0820 (Confirmed resistance zone)
Stop Loss: 1.0860 (Above key resistance to limit risk)
Take Profit 1: 1.0720 (+80 pips)
Take Profit 2: 1.0650 (+150 pips)
Take Profit 3: 1.0590 (Major support level)
📉 Key Indicators Supporting Sell Bias
Break Below Support: Price has breached 1.0800, signaling potential further downside.
Moving Averages: Trading below the 50-SMA and 200-EMA, confirming a bearish trend.
RSI: Below 50, indicating bearish momentum.
MACD: Bearish crossover, showing selling pressure.
Double Top Formation: Resistance at 1.0950 suggests further decline.
Conclusion:
EUR/USD is currently exhibiting bullish momentum across multiple timeframes, with key resistance levels approaching. Traders should monitor these levels closely and consider the outlined trade setup, ensuring adherence to risk management principles. As always, stay updated with economic events and market news that could influence currency movements.

EUROUSDT TRADING POINT UPDATE >READ THE CHAPTIAN Buddy'S dear friend
SMC Trading Signals Update 🗾🗺️ Euro USD Traders SMC-Trading Point update you on New technical analysis setup for Euro USD ) Euro USD Technical patterns support level pullback up trend 📈🚀 1.08254 strong 🪨 support level target 🎯 point Resistance level 1.09580 good luck 💯💯
Key Resistance level 1.09580
Key Support 1.08254
Mr SMC Trading point
Palee support boost 🚀 analysis follow)

EURUSD next breakout moveEUR/USD Intraday Analysis – Key Zones to Watch
The market structure for EUR/USD on the 15-minute chart presents a well-defined range with key trading zones.
🔸 Sell Zone – The price is currently trading near this zone, indicating potential short opportunities if bearish pressure increases.
🔸 Buy Zone – A key support level where buying interest may emerge, leading to possible bullish movements.
🔸 Target & Stop Levels:
Buy TP and Sell SL: Upper resistance level where buying targets align and sell stop-losses are triggered.
Sell TP and Buy SL: Lower support level acting as a sell target and buy stop-loss zone.
Traders should monitor price action around these zones for confirmations before entering trades.
📅 Date: March 24, 2025
📊 Chart: 15-Minute (EUR/USD)
💹 Broker: FXCM

EURUSD 24/03/25 MARKET ANALAYSISMonthly Chart (Long-Term Perspective):*
- *Trend:* The monthly chart shows a long-term bearish trend, with the pair trading below the 200-month moving average (MA). However, there are signs of a potential reversal as the RSI (Relative Strength Index) is approaching oversold territory (around 30).
- *Key Levels:*
- Resistance: 1.1500 (psychological level and previous swing high).
- Support: 1.0500 (multi-year low and psychological support).
*b. Weekly Chart (Medium-Term Perspective):*
- *Trend:* The weekly chart indicates a consolidation phase within a descending channel. The pair is currently testing the upper boundary of the channel, suggesting a potential breakout.
- *Key Levels:*
- Resistance: 1.1200 (upper boundary of the descending channel).
- Support: 1.0800 (lower boundary of the channel and recent swing low).
*c. Daily Chart (Short-Term Perspective):*
- *Trend:* The daily chart shows a bullish divergence on the RSI, indicating weakening bearish momentum. The pair is trading above the 50-day MA, suggesting short-term bullish bias.
- *Key Levels:*
- Resistance: 1.1100 (recent high and psychological level).
- Support: 1.0900 (50-day MA and recent swing low).
*Major Support Levels:*
- 1.0800 (descending channel support).
- 1.0500 (multi-year low and psychological support).
- *Major Resistance Levels:*
- 1.1100 (recent high).
- 1.1200 (upper boundary of the descending channel).
- 1.1500 (long-term psychological resistance).
*Position Sizing:* Risk no more than 1-2% of your trading capital on this trade.
- *Volatility Consideration:* Be mindful of high-impact economic events
Conclusion*
The EUR/USD pair is at a critical juncture, with potential for both bullish and bearish scenarios. Traders should wait for a confirmed breakout or breakdown before entering a trade, ensuring proper risk management and adherence to the outlined trade setup.

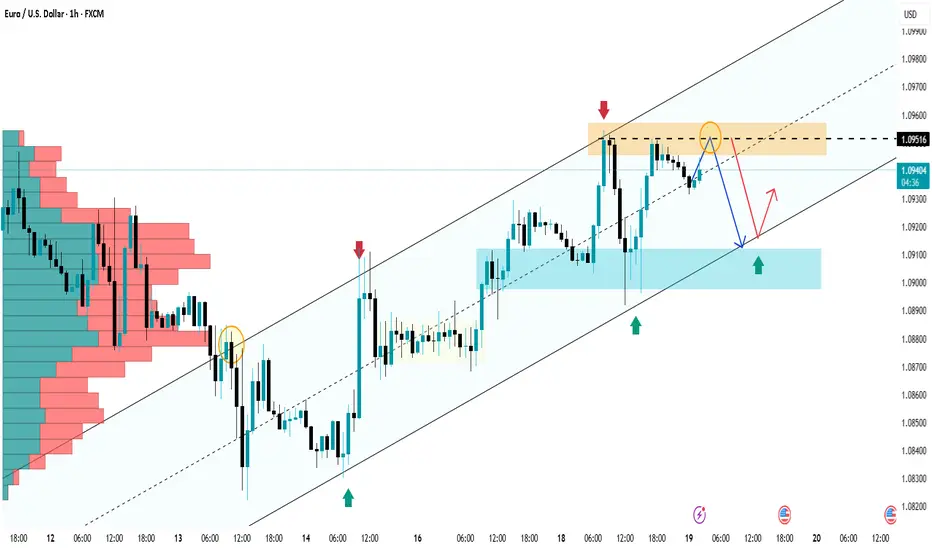
EUR/USD – FVGs, Liquidity Sweeps, and a Possible “Skip & Flip”1. Current Situation
No Previous Entry Model: The last analysis didn’t give us a clean entry signal, so we stayed on the sidelines.
Lots of FVGs on 1H & 4H: Due to the recent pump, we have several Fair Value Gaps (FVGs) that many traders expect price to fill before continuing higher.
Weekly FVG Above: There’s also a larger Fair Value Gap on the weekly timeframe that could act as a bigger magnet or rejection zone.
2. The “Obvious FVG” Trap
What Most Traders Expect: Many people are waiting for EUR/USD to drop into the nearest 1H/4H FVG to go long.
Why It Might Not Happen: If the market does fill that “obvious” FVG and then turns bullish, it could actually strengthen the bullish trend further—making it harder for “smart money” to later sweep out early sellers.
Market Makers’ Perspective: “When the market wants to go up, it doesn’t want to take you with it.” In other words, the market might skip or partially fill the obvious gap to avoid giving retail traders an easy entry.
3. Skip & Flip – Potential Scenario
Price Reverses from the Last Liquidity-Swept Order Block (OB):
Instead of dropping all the way into the obvious FVG, price may bounce off a less-noticed OB where liquidity was recently swept.
This stealthy move traps sellers who were waiting for the deeper pullback.
Bullish Run to the Weekly FVG:
Once it starts climbing, the market could head toward that weekly FVG above.
If it does, it may reject there, completing its “larger cycle” to the downside afterward.
Creating New FVGs for the Next Bearish Move:
As price rallies, it will likely form new bullish FVGs.
When the market finally wants to turn bearish, those newly created gaps become prime targets for a run back down, sweeping liquidity again.
4. Putting It All Together
Short-Term Bullish, Long-Term Bearish?
We might see a short-term push higher (skipping the obvious 1H/4H gap) before hitting the weekly FVG.
From there, watch for signs of a reversal to confirm the next leg down.
Patience & Confirmation:
If price does skip the obvious FVG, don’t chase it. Wait for confirmation (e.g., break of structure or a clear reaction from the weekly FVG) before jumping in.
If price surprises everyone and actually fills the 1H/4H FVG, then reevaluate—no single scenario is guaranteed.
5. Final Thoughts
Market Behavior Isn’t Always Textbook: Sometimes the most “obvious” levels get front-run or ignored entirely.
Watch for Liquidity Sweeps: The market loves to trap both buyers and sellers by sweeping liquidity, then moving in the opposite direction.
Stay Flexible: Plan for multiple scenarios. If one fails to materialize, switch to the next plan rather than forcing a trade.
Overall, the idea is that EUR/USD might not give the easy pullback everyone wants. Instead, it could pivot sooner, aim for the weekly FVG, and then potentially roll over from there. Keep your eyes on liquidity levels, manage risk carefully, and be ready to adapt if the market does something unexpected. Good luck!

EUR/USD – Following the Plan, Looking for a Bullish CHoCH Context Recap:
Previously, we anticipated a bounce from a key demand zone (gray box). Price has indeed started reacting in that area, aligning with our plan.
Now, we’re watching for a final liquidity sweep below the minor lows to confirm that sellers are exhausted.
Next Steps: Waiting for a CHoCH (Change of Character)
Minor Liquidity Sweep:
We want to see price dip just below the short-term low (creating a liquidity grab) before pushing higher.
This often flushes out weak longs and triggers any remaining sell stops, clearing the way for a fresh move up.
Change of Character (CHoCH) to the Upside:
A CHoCH is essentially a break of the recent bearish structure, signaling a potential shift to bullish momentum.
Keep an eye on lower timeframes (5M or 15M) for a strong push above the last swing high.
First Pullback Entry:
Once we see that bullish break, we look to enter on the first minor retracement (pullback).
This lets us join the potential uptrend at a better price instead of chasing the initial breakout.
Risk Management & Targets
Stop Loss Placement:
Below the new swing low (the liquidity sweep area), so if price unexpectedly reverses, you’re protected.
Targets:
Aim for key resistance levels or liquidity pools above, which could include previous session highs or supply zones.
Why This Makes Sense
Smart Money Concepts (SMC): Liquidity sweeps and CHoCHs are classic signs that “smart money” might be switching gears from bearish to bullish.
Confluence: We already saw a reaction from the higher timeframe demand zone, so additional bullish signals reinforce our trade idea.
Final Thoughts
Patience is Key: Don’t jump in until you see that clear sweep and CHoCH.
Adapt if Needed: If the liquidity sweep doesn’t happen or price breaks below the demand zone, be ready to step back and re-evaluate.
Overall, EUR/USD looks poised for a potential push higher—just wait for that final flush of liquidity and a clear sign of strength before entering long. Good luck and trade safe!

EUR/USD – Potential Bounce from Key Demand Zone 20/3/2025Below is a simplified breakdown of the chart and a potential game plan. Note that any path you see drawn on the chart is a forecast, not actual price action that’s already happened—it’s just a hypothetical scenario.
1. Overall Context
Recent Sell-Off: EUR/USD dropped into a higher timeframe demand zone (gray area). Buyers often look for opportunities here if the zone holds.
Liquidity Grab: The market typically hunts major lows or session lows for liquidity. A sweep of these lows can be the catalyst for a reversal.
2. Session Analysis
London Session (Colored Box): Often sets the day’s direction. In this case, it pushed price down into the demand zone.
New York Session (Another Box): Can continue the move or spark a reversal. Watch closely for a bullish reaction once NY opens.
3. Trade Idea – Looking for a Bullish Reversal
Demand Zone Entry
Why? Price is at a key demand area, which can attract buyers.
Confirmation: On lower timeframes (e.g., 5M or 15M), look for a shift in structure—like a break above minor resistance or a clear bullish pattern—to confirm momentum is turning up.
Potential Targets Above
There are several liquidity levels or previous highs overhead. These make logical places to take partial profits or move stops to break-even.
Stop Loss Placement
Ideally below the recent swing low within the demand zone. This helps protect you if price decides to push even lower.
4. What Could Invalidate the Idea?
Deeper Break of Demand: If the pair convincingly drops below the gray zone, the bullish thesis weakens.
Lack of Bullish Confirmation: If price doesn’t show any sign of reversing, it’s best to avoid forcing a long position.
5. Final Thoughts
Patience is Key: Let price action prove it wants to go higher. Jumping in too early can lead to drawdowns if the drop continues.
Don’t Confuse the Path Tool with Reality: The drawn path is just a hypothetical projection. Price may follow it—or it may not. Always wait for real-time confirmations.
Stay Flexible: If the market continues downward, adapt and wait for a fresh setup.
By combining session awareness with a solid understanding of demand zones and liquidity sweeps, you can increase the odds of catching a potential bounce. Good luck and trade safe!

EURUSD Next moveI'm currently analyzing EUR/USD on the **15-minute timeframe**, and the price action suggests a strong **bearish setup**. The market has shown a **Break of Structure (BOS)**, confirming the downward trend, with multiple **mini supply zones (SS) and a 15-minute SS** acting as key resistance levels. After the recent drop, I'm expecting a **pullback into the supply zone around 1.08837**, where price could face rejection before continuing lower. My main **target is 1.08270**, aligning with the overall bearish momentum.
From a risk management perspective, my **stop-loss is set above the supply zone at 1.09201**, ensuring a favorable **risk-to-reward (R:R) ratio** for this trade. Additionally, the **Dollar Index (DXY) remains strong**, supporting further downside for EUR/USD. With upcoming **U.S. economic data releases**, volatility could increase, making it essential to monitor market conditions. If price respects the key supply zones, this trade could present a high-probability short opportunity. Let me know your thoughts in the comments! 🔥💰 #forex #eurusd #smartmoney #trading

EURUSD today: SELL or BUY ? Hey fellow traders, let’s chat and exchange insights on EUR/USD!
Today, EUR/USD continues to hold its bullish momentum, moving within an upward price channel on the 1-hour chart. In the short term, the pair remains supported, trading above the EMA 34 and 89, signaling further potential upside.
The Euro (EUR) has gained support from progress in peace talks between Russia and Ukraine. However, market sentiment could shift quickly depending on developments in the conflict, making it crucial for traders to monitor geopolitical news and economic data closely in the coming days.
With traders waiting eagerly for new policy updates, USD is not being favored as an investment option, allowing EUR/USD to maintain its advantage.
💡 What’s your take on EUR/USD? Share your thoughts below! ⬇️
EUR/USD Trading Plan: Key Support, Resistance & Entry PointsNEWS:
Federal Reserve's Interest Rate Decision: The Federal Reserve is scheduled to announce its latest interest rate decision today. Market participants largely anticipate that the Fed will maintain current rates, with potential rate cuts projected for June. The Fed's updated interest rate projections, also due today, could significantly influence market expectations.
FXSTREET
Technical Indicators: The EUR/USD's recent ascent has brought it to the 1.0950 region, marking a new multi-year high. The pair's bullish momentum is evident as it continues to test this significant level.
Technical Indicators:
Moving Averages: The pair is trading above its 50-day Simple Moving Average (SMA), reinforcing the bullish momentum.
EASY TRADING TIPS
Relative Strength Index (RSI): The RSI is approaching overbought territory, indicating potential for a short-term correction.
TRADE SETUP
BUY
ENTRY POINT: 1.0440
TP 1.12136
SL 1.0937
Entry Point: Consider entering a long position upon a confirmed breakout above the immediate resistance at 1.0945.
Take Profit (TP): Set TP at 1.1165, the next significant resistance level.
FOREX24.PRO
Stop Loss (SL): Place SL below the immediate support at 1.0884 to manage potential downside ris

GOLD TRADING POINT UPDATE >READ THE CHPTAIAN Buddy'S dear friend 👋.
SMC Trading Signals Update 🗾🗺️ Euro USD Traders SMC-Trading Point update you on New technical analysis setup for Euro USD) Euro USD still going to bullish trend 🚀 analysis update 1.09483 rejected point below 👇 trend following support level again back up trand 1.09129 - 1.08959 support level buying zone ☺️ 🥂
Target 🎯 point 1.09865 good luck 💯💯🤞
Key Resistance level 1.09476 + 1.09865
Key Support level 1.09129 - 1.08959
Mr SMC Trading point
Pales support boost analysis follow)

EURUSD next moveMarket Structure & Price Action Analysis:
The EUR/USD pair on the 15-minute timeframe has exhibited a clear bullish structure, with price forming higher highs (HH) and higher lows (HL), indicating an uptrend continuation.
A Break of Structure (BoS) was observed on the 15-minute chart, which acted as a confirmation of bullish momentum.
After the BoS, price retraced into a 15-minute demand zone (15-Zone), marked in green, which was previously a liquidity grab before the expansion to the upside.
Liquidity & Institutional Order Flow:
Multiple sub-swings were identified, showing market consolidation before the impulsive breakout.
The liquidity sweep at the 15-zone demand area (green zone) suggests that institutional traders (smart money) induced selling pressure before driving price higher.
The 4-hour supply zone (marked in blue) has been mitigated, causing a rejection from the premium pricing zone, indicating potential distribution and a pullback.
Next Probable Move & Trading Plan:
Bullish Bias: If price sustains support above the 15-zone demand area, we can expect a continuation towards the 4-hour supply zone for another retest.
Bearish Correction: A failure to hold this demand could result in a short-term retracement towards the previous low near 1.0883, where liquidity may be resting.

EUR/USD Bullish Breakout – Trade Setup & AnalysisTrendline Breakout
🔹 Price has broken above a descending trendline, signaling a bullish move.
📊 Trade Setup:
🟢 Entry Point: 1.08621
🟡 TP1: 1.08895
🔵 Target: 1.09612
🔴 Stop Loss: 1.08270
📈 Market Outlook:
✅ Bullish bias as long as price stays above 1.08621.
🚀 If momentum holds, the next key resistance is 1.09190, followed by the final target at 1.09612.
⚠️ Risk Managed: Stop-loss at 1.08270 to limit downside risk.
🔎 What to Watch:
🟠 If price retests 1.08621 and holds, it may be a good buy confirmation.
🔺 Breaking 1.09190 could trigger more upside momentum.

EUR/USD SET FOR A BREAKOUT? KEY LEVELS TO WATCH!📌 Technical Analysis
The EUR/USD pair is currently trading within a well-defined ascending channel on the H4 timeframe, indicating a potential bullish breakout. Here are the key insights from the chart:
Trend Outlook
The pair remains in an uptrend, currently hovering around 1.0896.
Resistance at 1.0931 is crucial—if broken, the price may surge toward the 1.0989 target.
Support & Resistance Levels
Key Support Zones: 1.0853 - 1.0875
Key Resistance Zones: 1.0931 - 1.0989
Possible Scenarios
If EUR/USD holds above 1.0875, a push toward 1.0931 is likely. A breakout above 1.0931 could drive the price to 1.0989.
Conversely, if the pair fails to hold support at 1.0875, it could retrace to 1.0853 before rebounding.
Market Signals
Current Trend: Bullish
Breakout Potential: A confirmed break above 1.0931 could accelerate bullish momentum.
Candle Structure: Price consolidation suggests a strong move is coming—either an upward breakout or a short-term pullback before resuming the uptrend.
📊 Fundamental Analysis
FED & Interest Rate Impact
The upcoming FOMC meeting is a key event this week, as traders expect the Fed to hold interest rates steady.
A dovish stance from the Fed could weaken the USD, pushing EUR/USD higher.
However, if the Fed signals a potential rate hike, the USD may strengthen, pressuring EUR.
Eurozone Economic Factors
The European economy remains fragile, but if upcoming inflation & GDP data show signs of recovery, EUR/USD could continue rising.
Weak economic data, however, might result in downward pressure on the euro.
Geopolitical Influence
Recent geopolitical tensions, including US-Iran relations and global trade risks, could impact market sentiment.
If uncertainty rises, USD may regain strength, potentially limiting EUR/USD gains.
🎯 Trading Strategy & Key Takeaways
✅ Overall Bias: Bullish
✅ Support Levels: 1.0853 - 1.0875
✅ Resistance Levels: 1.0931 - 1.0989
✅ Preferred Setup:
Buy near 1.0875, targeting 1.0931 and possibly 1.0989 if a breakout occurs.
Watch for pullbacks before confirming entry points.
⚠ Risk Management Alert!
A break below 1.0853 may trigger further declines—watch price action closely.
Stick to TP/SL and adapt to market volatility, especially with major economic data releases.
📢 What’s your take on EUR/USD? Will it break out or consolidate further? Drop your thoughts below! 🚀🔥

EURUSD ANALYSIS OF MARKET 17/03/25As of *March 17, 2025, the **EUR/USD* currency pair is exhibiting a mixed technical and fundamental outlook, with key levels and potential breakout points offering actionable trade setups. Below is a comprehensive analysis, including multiple timeframe perspectives, support and resistance levels, and a detailed trade plan.
NEWS :
Trade Tensions: President Trump has intensified trade measures, notably doubling tariffs on Canadian steel and aluminum imports to 50%. This escalation has contributed to a sell-off in global stock markets and heightened concerns about a potential U.S. recession, often referred to as a "Trumpcession."
Eurozone Fiscal Policies: Germany has agreed on a debt overhaul and a significant increase in state spending, providing support to the euro.
Support and Resistance Levels:
Immediate resistance for EUR/USD stands at 1.0946, the high from March 11, 2025. A clear push beyond this level could target 1.0969 (the 23.6% Fibonacci retracement) before approaching the pivotal 1.1000 zone.
Weekly Chart (Medium-Term Perspective)*
- *Trend: The weekly chart shows a bullish bias, with the pair trading above the **200-week moving average (MA). However, price action has stalled near **1.1300*, a key resistance level.
- *Key Levels*:
- *Resistance: **1.1300* (immediate resistance) and *1.1500* (monthly resistance).
- *Support: **1.1000* (psychological level) and *1.0800* (200-week MA).
- *Indicators*: The MACD is in positive territory but flattening, signaling a potential slowdown in bullish momentum.
*Key Support and Resistance Levels*
- *Major Support: **1.1000*
- *Major Resistance: **1.1500*
- *Breakout Levels*:
- *Bullish Breakout: A sustained move above **1.1300* could target *1.1500* and beyond.
- *Bearish Breakout: A break below **1.1100* could open the door for a move toward *1.1000* and *1.0800*.
Fundamental Considerations*
- *EUR*: The European Central Bank (ECB) has maintained a cautious stance, but improving economic data in the Eurozone, particularly in Germany and France, could support the euro.
- *USD*: The Federal Reserve's monetary policy remains a key driver. Any dovish signals or hints of rate cuts could weaken the USD, benefiting the EUR/USD pair.
- *Geopolitical Risks*: Ongoing geopolitical tensions, particularly in energy markets, could impact the pair, given Europe's reliance on energy imports.
---
### *Conclusion*
The *EUR/USD* pair is at a critical juncture as of *March 17, 2025, with the potential for a significant breakout or reversal depending on price action around key levels. Traders should monitor the **1.1300* and *1.1100* levels closely and wait for confirmed breakouts before entering trades. Proper risk management, including the use of stop-loss orders and position sizing, is essential to navigate potential volatility.

EUR/USD Analysis: Bullish Breakout Towards 1.09524EUR/USD 30-Minute Analysis – Potential Bullish Breakout Towards 1.09524 📈
Key Observations:
Support Level: Around 1.08700, acting as a critical area for price action.
Resistance Zones: A key resistance area is visible around 1.09000 before reaching the target of 1.09524.
Moving Averages:
The 30 EMA (red) at 1.08747 is currently near price action, indicating short-term dynamic support.
The 200 EMA (blue) at 1.08601 suggests a broader trend still in transition.
Trendlines & Structure:
A downward trendline has been broken, and price is now retesting previous resistance-turned-support.
The expectation is a bounce from the support area leading to a potential bullish move.
Potential Trade Setup:
Bullish Scenario: If price holds above the 1.08700 support, a push toward 1.09524 could be expected.
Bearish Scenario: A failure to hold the support may indicate a return to the 1.08600 region.

EUROUSD TRADING POINT UPDATE > READ THE CHPTIANBuddy'S dear friend
SMC Trading Signals Update 🗾🗺️ SMC-Trading Point update you on New technical analysis setup for Euro USD) Euro USD) Technical patterns choch looking for Bullish patterns support level 1.0866 Resistance level 1.09361 ) good luck guys 🤝
Key Resistance level 1.09361+ 1.09483
Key Support level 1.08802 - 1.08666
Mr SMC Trading point
Pales support boost 🚀 analysis follow)

EURUSD MULTI TIME FRAME ANALYSISHello traders , here is the full multi time frame analysis for this pair, let me know in the comment section below if you have any questions , the entry will be taken only if all rules of the strategies will be satisfied. wait for more price action to develop before taking any position. I suggest you keep this pair on your watchlist and see if the rules of your strategy are satisfied.
🧠💡 Share your unique analysis, thoughts, and ideas in the comments section below. I'm excited to hear your perspective on this pair .
💭🔍 Don't hesitate to comment if you have any questions or queries regarding this analysis.

EURUSD - Emotion was wrong Perfect Setup Rule was RIGHTEURUSD 1W Fisher was in uptrend. 1D fall was limited due to 1W positive Fisher. But emotions prevailed over Perfect Setup Rule and the result was wrong observation in my previous post. This happened due to fast changing tariff and geopolitical related global scenario. And irony is that Right observation was within the prediction itself which was blatantly ignored by me. A minor fall in 1D Fisher only trigerred 1W TSI thus making the up move more strong in EURUSD. Emotions are very costly in trade decisions. Please see my previous post on EURUSD.
TAKEAWAY - Stick to Rules. Emotions will only ruin your trade.
WRONG ANALYSIS I MUST ADMIT: Here is the Text of Wrong Analysis (See the solution in problem itself) -
"With 3 Month and 1 Month Fisher Negative Crossover, 1W maximum
upside (KOD) is achieved. Perfect Setup in 1 Day where its upside target
has been achieved where Fisher has gone well above 0 and /TSI unable
to cross 0 and this is called FFFHTSI i.e. Full Fisher Half TSI.
It is going to fall so that a TSI double bottom on 1 Week Chart will be the extent of this fall.
Negative for few Weeks."
And this is why PERFECT SETUP RULE is so powerful for analysis.

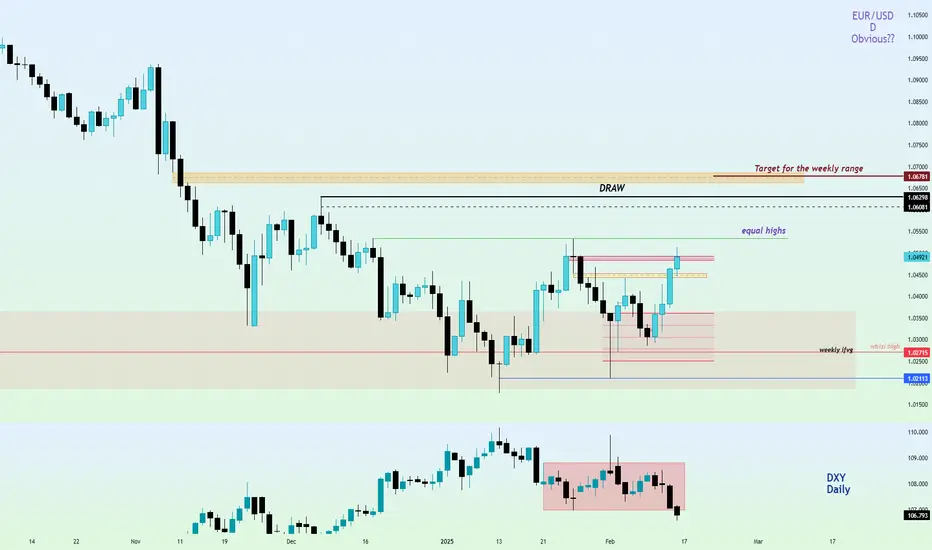
Fibre/EURUSD ready to move higher...Hello traders!
There is so much on the Daily chart of Fibre that points to obvious bullishness of the market that I could not place all of it on the chart. But I have marked what seemed crucial to be seen.
Market has taken smooth lows of 15th, 16th, 17th, & 20th January, 2025 and strongly rejected from 1.02113 . Also, observe how 20th January's daily candle shifted the market structure . We're inside a Bullish breaker on the daily, supported by a daily ifvg (check how the market has respected the consequent encroachment of that gap perfectly).
Things don't end here. DXY has broken the range to the downside with lower draws. Market symmetry is currently missing but Fibre should follow DXY soon.
The draw and the targets for the weekly range have been marked on the chart. Equal highs is the low hanging fruit.
Narrative is paramount when it comes to applying ICT concepts. That takes a lot of practice and time. Having said that, let's discuss when this idea will be marked as failed. 3 PDAs. If 3 PDAs fail on the daily timeframe, I'll not engage the market and wait for more feedback from the market.
Have a wonderful and learning-oriented week.
GLGT.
EUR/USD Trading Plan: Key Support, Resistance & Entry PointsAs we analyze the EUR/USD currency pair for March 11, 2025, we will look at multiple timeframes, key support and resistance levels, potential breakout points, and a detailed trade setup.
1. High-Quality Analysis: Overview
Recent economic data trends from both the Eurozone and the U.S. indicate continued divergence in monetary policy outlook, influencing the EUR/USD dynamics. The European Central Bank (ECB) is leaning towards a more hawkish stance due to persistent inflation, while the Federal Reserve (Fed) is more cautious, reflecting mixed economic signals.
2. Multiple Timeframe Perspectives
Daily Chart:
The daily chart shows that EUR/USD has been consolidating in a range between 1.0900 and 1.1000. A breakout above or below this range could set the trend for the next few trading sessions.
4-Hour Chart:
On the 4-hour chart, the price action shows minor spikes around 1.0930 - 1.0960, indicating short-term support and resistance levels within the larger daily range.
1-Hour Chart:
The hourly chart presents a more refined view of intraday movements, showing oscillations around 1.0950, indicating a potential pivot point for short-term traders.
3. Key Support and Resistance Levels
Support Levels:
1.0930: A crucial intraday support level showing previous price rejection.
1.0900: A significant psychological level and prior low.
Resistance Levels:
1.0960: A nearby resistance level that's been tested multiple times.
1.1000: A strong resistance level that aligns with the daily high.
4. Breakout Points
Bullish Breakout: A move above 1.0960 would confirm a bullish breakout, targeting higher levels such as 1.1000.
Bearish Breakdown: A fall below 1.0930 could lead to testing lower levels toward 1.0900.
Detailed Trade Setup
Trade Idea: Bullish Scenario
Based on the current analysis and outlook, we'll set up a bullish trade.
Entry Point:
1.0965: Just above the resistance level to capture momentum on a breakout.
Stop Loss (SL):
1.0945: Placed slightly below the support level at 1.0950 to limit potential losses.
Take Profit (TP):
1.0990: Targeting just below the strong resistance level at 1.1000 for a risk-to-reward balance.
Risk Management
Risk on Trade:
From entry at 1.0965 to the stop loss at 1.0945, the risk is 20 pips.
Potential Reward:
From entry at 1.0965 to take profit at 1.0990, the target is 25 pips.
Risk-Reward Ratio:
Risk-Reward Ratio: 1:1.25 (Risk of 20 pips for a potential gain of 25 pips).
Summary of Recommendations
Action: Buy EUR/USD
Entry: 1.0965
Stop Loss: 1.0945
Take Profit: 1.0990
Final Considerations
Market Sentiment: Monitor economic data releases, particularly from the U.S. and Eurozone, as these could impact existing positions.
Adjust Strategy: Be ready to adapt the trade setup based on real-time market developments, and use additional indicators (like RSI, MACD) for confirmation.
Stay Informed: Follow news on central bank developments and global geopolitical events that may influence market trends.

EUR/USD Trading Plan: Key Support, Resistance & Entry PointsThe EUR/USD currency pair is one of the most traded pairs in the world and is often influenced by various factors, including economic indicators, geopolitical events, and monetary policies from the European Central Bank (ECB) and the Federal Reserve (Fed). As of March 10, 2025, the pair has been showing volatility due to recent economic data releases, interest rate expectations, and market sentiment.
Daily Chart Analysis:
• Trend: The daily trend shows a bullish outlook, with the EUR/USD maintaining above the 200-day moving average.
• Key Levels:
o Support: 1.0900
o Resistance: 1.1050
4-Hour Chart Analysis:
o Trend: The 4-hour chart indicates a recent bullish correction after a small pullback.
o Key Levels:
Support: 1.0930)
Resistance: 1.1040
1-Hour Chart Analysis:
o Trend: Short-term gauges a consolidation phase.
o Key Levels:
Support: 1.0920
Resistance: 1.0990
Key Support and Resistance Levels
• Support Levels:
o 1.0900: Strong psychological level and previous resistance.
o 1.0850: Fibonacci level that provides additional support.
• Resistance Levels:
o 1.1050: Recent swing high, seen as major resistance.
o 1.1100: Upper bound of the recent trading range.
Breakout Points
• A breakout above 1.1050 could signal further bullish momentum, targeting 1.1100 and potentially higher levels, depending on broader market conditions.
• A breakdown below 1.0900 would indicate bearish sentiment, possibly retesting lower support levels at 1.0850.
Trade Setup
Trade Idea
Bullish Setup: Buy EUR/USD
• Entry Point: 1.0955 (confirmation above key resistance on the 1-hour or 4-hour)
• Stop Loss: 1.0920 (below the recent support level)
• Take Profit: 1.1050 (targeting the established resistance)
✅ #forex
✅ #forextrading
✅ #forexanalysis
✅ #forexsignals
✅ #fxtrading
✅ #trading
✅ #eurusd
✅ #eurusdforecast
✅ #eurusdanalysis
✅ #eurusdtrading
✅ #eurusdsetup
✅ #eurusdsignal
✅ #technicalanalysis
✅ #priceaction
✅ #supportandresistance
✅ #trendanalysis
✅ #chartpatterns
✅ #elliottwave
✅ #swingtrading
✅ #daytrading
✅ #scalping
✅ #riskmanagement
✅ #tradingpsychology
✅ #tradingview
✅ #forexcommunity
✅ #marketanalysis
