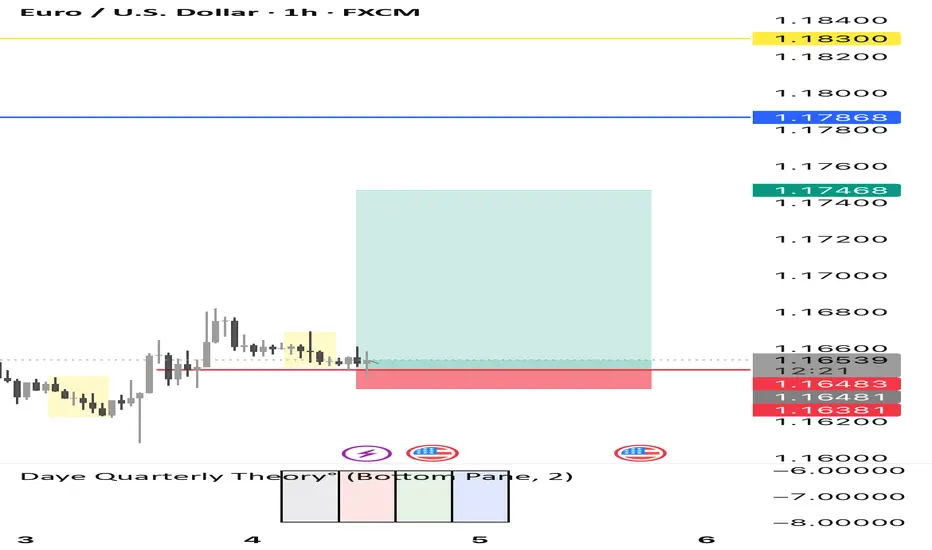
EUROUSD - LongIn this 30-minute chart of EUR/USD where we can see a hammer candle forming exactly at a key support level. A hammer candle indicates that sellers tried to push the price down but buyers came in strongly and managed to close the candle near the opening level. This shows buying interest at the support zone.
Entry: A possible long entry can be considered once the price moves above the high of the hammer candle. Waiting for confirmation above the high reduces the chances of a false signal.
Stop Loss: The stop loss should be placed just below the low of the hammer candle. If the price breaks below that level, it indicates that the support did not hold.
Target: The first target can be set near the recent swing high. If momentum continues, further targets can be trailed higher by adjusting the stop loss. This way, you protect profits while keeping the trade open for a larger move.
Always remember to manage risk properly and not to risk more than a small percentage of your trading capital on a single trade.
USDEUR trade ideas

EUR/USD Buy Plan | SMC ConceptDaily TF: Bullish
4H TF: Bullish
The market structure on EUR/USD remains intact to the upside. Following Smart Money Concepts (SMC), I am looking for potential long opportunities based on liquidity and fractal structure.
📌 Buy Scenarios
1. Current Price Area (Aggressive Entry)
Entry: 1.17370 (Market trading here now)
SL: 1.16980
Note: This is a risky entry since the price hasn’t retraced deeply yet.
2. Proper Retracement Area (Best Discounted Entry)
Entry: 1.16798
SL: 1.16075
Note: This level aligns with deeper retracement and provides a discounted price for higher RR setups.
🧠 SMC Notes
Daily + 4H trend is both bullish.
Liquidity grabs and fractal structure will decide the next clean move.
Monitor price reaction carefully around these two zones for confirmation.
⚠️ Disclaimer: This is for educational purposes only, not financial advice. Always manage risk properly.

EURUSD(20250909) Today's AnalysisMarket News:
New York Fed Survey: Consumers expect unemployment and job losses to rise, and the Fed is expected to cut interest rates next week.
Technical Analysis:
Today's Buy/Sell Levels:
1.1743
Support and Resistance Levels:
1.1804
1.1781
1.1766
1.1719
1.1704
1.1681
Trading Strategy:
If the price breaks above 1.1766, consider buying, with the first target price at 1.1781.
If the price breaks below 1.1743, consider selling, with the first target price at 1.1719

EURUSD(20250905) Today's AnalysisMarket News:
The US August "Non-Farm Payrolls" report came in at 54,000, below the expected 65,000. The previous figure was revised up from 104,000 to 106,000. Initial jobless claims rose unexpectedly to 237,000 last week, the highest level since June.
Technical Analysis:
Today's Buy/Sell Levels:
1.1648
Support and Resistance Levels:
1.1688
1.1673
1.1664
1.1633
1.1624
1.1609
Trading Strategy:
On a breakout above 1.1648, consider a buy entry, with the first target at 1.1664.
On a breakout below 1.1633, consider a sell entry, with the first target at 1.1624.

BUY EURUSDEUR/USD – Buy Setup 📈
Entry: 1.16564
Stop Loss: 1.16058
Take Profit: 1.18758
Reasoning: Price bounced from key supportwith bullish candlestick confirmation.

EUR/USD Long SetupPrice consolidating after recent downside move.
Entry taken from demand zone with stop below structure and target towards recent highs.
Looking for bullish continuation as liquidity builds to the upside.
REMEMBER THIS IS A HIGH RISK TRADE(Not the best setup possible)

EURUSD 1H Chart – Bullish Setup✅ Support: 1.1640–1.1650
🎯 Targets: 1.1746 / 1.1786 / 1.1830
⛔ SL: Below 1.1638
Bias: Bullish as long as above support. Upside momentum may push towards 1.1830.
#Forex #Trading #EURUSD #PriceAction
EUROUSD📊 What is a Liquidity Sweep?
A liquidity sweep happens when price moves below/above a key support or resistance level to trigger stop-loss orders or capture liquidity before reversing in the opposite direction. Big players (institutions/smart money) push price into these zones to collect orders. Retail traders often get stopped out, while institutions use that liquidity to enter positions at better prices.
🔍 In This Chart (EUR/USD, 1H)
Multiple Equal Lows (Support Zone)
Notice the “X X X” marks where price tested the same level several times. This creates an obvious support zone that many retail traders use to place stop-loss orders just below.
Liquidity Sweep Event
Price dipped below the support (fake breakdown).
This triggered stop-losses and sell orders, providing liquidity to bigger players.
Strong Reversal Up
Right after the sweep, price quickly reversed upward.
This shows that institutions likely used the collected liquidity to enter long positions.

EURUSD BUY PLAN - DAY TRADE SETUPEURUSD is showing strength on 1 HR Time frame, swept Asian Session liquidity of both sides. Now clear structure break upside, Plan for buy is market retrace towards FIB Area 0.79 aligned with ORDER BLOCK + FVG . Best entry if Market creates Inducement at Fib level 0.5 and retrace towards 0.79 and place entries at that Particular are 1.16270 to 1.16255 Area.

Which Bank Offers Better Returns – Public or Private?Quick Take (TL;DR)
Depositors (savings accounts & fixed deposits): Private banks often advertise higher headline savings rates at certain balance slabs and run frequent FD specials for short tenors. But public sector banks can be competitive on standard FD slabs and usually have lower charges that protect your net return—especially for low or moderate balances.
All-in net return for everyday customers: If you maintain small-to-mid balances and value minimal fees, PSBs can deliver higher net effective returns after costs. If you maintain large balances, use digital tools, and chase promotional rates, private banks may deliver higher effective yields.
For long-term wealth growth (mutual funds, SIPs, bonds via the bank channel): Returns depend on the product, not the bank’s ownership. Choose based on product selection, fees, and advice quality, not whether the bank is public or private.
For bank shareholders (investing in bank stocks): Historically, private banks have often delivered higher shareholder returns thanks to faster loan growth and higher ROE, but this comes with valuation risk and cyclicality. Several PSBs have improved profitability lately; stock selection matters more than the category label.
What Do We Mean by “Returns” From a Bank?
“Returns” can mean different things depending on your relationship with the bank:
Depositor returns – Interest and benefits you earn on savings accounts, current accounts (indirect through perks), fixed deposits (FDs), recurring deposits (RDs), and sometimes special deposit schemes.
Net effective return – Your interest earned minus fees, penalties, and opportunity costs. This is the real-world number that matters.
Ecosystem returns – Value from cashback, rewards, lounges, insurance benefits, and digital features like auto-sweep or goal-based savings that nudge you to earn more.
Investment returns via the bank – Mutual funds, bonds, SGBs, NPS, and PMS that you buy through the bank’s platform or RM. The bank is a distributor, not the manufacturer; returns depend on the underlying product.
Shareholder returns – If you buy the bank’s equity shares or AT1 bonds, you’re seeking capital gains, dividends, and coupon income. This is a separate lens from being a customer.
We’ll analyze each lens for public vs private.
Savings Accounts: Headline Rates vs Reality
Headline Savings Interest
Private banks often publish tiered, higher savings rates for balances above certain slabs (say ₹1 lakh, ₹5 lakh, or ₹10 lakh+), or during promotional windows, to attract deposits.
Public sector banks usually offer more uniform savings rates across slabs, updated less frequently, with fewer short-term promotions.
But beware of tiers: A higher “up to X%” rate might apply only above a certain balance; the rest earns a lower rate. Also, rates can adjust quickly.
Fees and Minimum Balance
Private banks tend to have higher non-maintenance charges for failing to keep a minimum average balance, plus bundled fees (debit card annual fees, SMS alerts, cash transaction limits).
PSBs generally keep lower minimum balances and lower penalties, especially for basic savings accounts and rural/semi-urban branches.
Net effect: For small-to-mid balance savers who occasionally miss minimum balance targets, PSBs can deliver a higher net return after avoiding private-bank penalties.
Digital & Auto-Sweep Features
Many private banks lead on auto-sweep (surplus from savings sweeps into higher-yield term deposits and back when needed) and goal-based saving.
Several PSBs also offer sweep-in FDs and improving mobile apps, but private players typically push these more aggressively.
If you use auto-sweep well, your effective savings yield can edge higher in a private bank. If you prefer simpler banking with no surprises, a PSB can be more predictable.
Verdict on Savings Accounts:
Low/irregular balances + fee sensitivity → PSB likely better net return.
High balances + savvy use of sweep & promos → Private can win.
Fixed Deposits (FDs) & Recurring Deposits (RDs)
FD Rate Levels and Promos
Private banks frequently run “special FD” campaigns (e.g., odd tenors like 444 days, 555 days) at attractive rates.
PSBs set rates with stability in mind; during rate up-cycles, some PSBs are equally competitive on standard tenors, especially for senior citizens.
Premature Withdrawal & Breakage
Both segments charge penalties for premature withdrawal, but policy transparency and consistency varies by bank rather than ownership. Always read the fine print.
Senior Citizen Rates
Both PSBs and private banks add 50–80 bps (varies by bank) for senior citizens. PSBs often market guaranteed feel + branch support, which many retirees value. Private banks sometimes add targeted senior specials too.
Safety Considerations
All scheduled banks are regulated by the RBI; deposits are insured by DICGC up to ₹5 lakh per depositor per bank. Above that, spread across banks if safety is a concern.
Sovereign perception: Many depositors trust PSBs more in tail-risk scenarios thanks to implicit state backing. Private banks are safe overall, but perceived risk can affect depositor comfort.
Verdict on FDs/RDs:
Rate-chasers may find private bank specials occasionally superior.
Standard tenors and senior citizen slabs can be equally competitive, and PSBs sometimes match or top at peak cycles.
For very conservative savers, PSBs can feel safer (perception), though insurance norms are the same across banks up to ₹5 lakh.
The Hidden Variable: Fees, Penalties, and Friction
Even a 0.5% higher FD rate can be neutralized if you regularly incur account fees, cash handling charges, cheque book charges, or debit card annual fees.
PSBs: Lower fee schedules for basic services; branch-based processes can be slower, which is a “time cost” rather than cash, but matters less for pure deposit returns.
Private banks: Sleek apps, instant processing, and better digital experiences—time saved is a value. However, fee vigilance is crucial.
Rule of thumb:
If you’re organized and keep balances above required thresholds, private banks can edge out on total experience + slightly better yield.
If you’re hands-off and sometimes drop below minimums, PSBs may deliver higher net returns simply by not eroding them with charges.
Value-Adds: Rewards, Cashbacks, and “In-Kind” Returns
Credit Cards & Rewards
Private banks dominate the premium and super-premium credit card space with strong reward earn rates, co-brands (airlines, fuel, e-commerce), and accelerated categories.
PSBs have improved, but private banks still lead on breadth and redemption ecosystems.
If you optimize credit card rewards, a private bank ecosystem can substantially raise your effective annual return (cashback, miles, vouchers). If you don’t optimize, the benefit narrows.
Salary Accounts and Offers
Private banks often bundle salary accounts with fee waivers, lounge access, and exclusive FD rates, improving the net benefit.
PSBs sometimes have government/PSU tie-ups with steady perks but fewer flashy promotions.
Insurance & Add-ons
Complimentary accident cover, lost card liability, and travel insurance exist across both types. The fine print (caps, conditions) matters more than ownership.
Verdict on value-adds: Private banks typically offer richer, more gamified rewards ecosystems. If you’re an optimizer, this tilts returns in their favor. If not, the gap is small.
Cross-Sold Investments: Do Private Banks Deliver Higher Returns?
When you buy mutual funds, SGBs, NPS, corporate FDs, or bonds through a bank, you are using the bank as a distributor. Your product return depends on:
The specific fund/asset, not the bank’s ownership.
Expense ratios/loads, which may differ by share class or channel.
Advisor quality and suitability—are you being sold high-commission products or the right fit?
Key point: Don’t assume “private bank = higher returns” on MF SIPs or bonds. The alpha is in fund selection, asset allocation, costs, and discipline, not in whether the distributor is public or private. Many PSBs also distribute leading fund houses.
Best practice:
Choose direct plans where you can and if you are comfortable DIY (lower expense ratio).
If you need advice, judge the RM quality, ask about commissions, and insist on suitability (risk profiling, goals, horizon).
Wealth Management & RM Quality
Private banks often staff relationship managers with sales targets, broader product shelves, and premium experiences (priority banking, lounges, white-glove service).
PSBs provide improving wealth desks but tend to be process-centric rather than sales-heavy.
Returns impact: A good RM who keeps you allocated correctly, rebalances, and avoids behavior mistakes can add more value than a 50–75 bps difference in deposit rates. Conversely, frequent churning into high-commission products can erode returns.
Business Banking: Working Capital & Treasury Returns
For SMEs and self-employed professionals, “returns” include the cost of funds and cash management:
Private banks excel at digital collections, virtual accounts, payment gateways, sweeps, cash concentration, and API banking, enabling better float management and interest optimization on idle cash.
PSBs are improving, with competitive cash credit rates, strong PSU tie-ups, and reach in semi-urban/rural markets. Documentation can be heavier, but rates and collateral norms can be favorable for certain government-linked schemes.
Net effect: If you can leverage digital treasury tools well, private banks might help you earn more on idle balances and lower leakage. If you value schematic lending and broad branch access, PSBs can be advantageous.
Safety, Stability, and the “Peace-of-Mind” Return
The probability of a regulated Indian bank failing is low, but depositor comfort matters:
PSBs carry sovereign majority ownership, which many interpret as an additional comfort layer in extreme stress scenarios.
Private banks are closely supervised; India has a track record of swift regulatory action to protect depositors.
Behavioral return: If you sleep better keeping large sums in a PSB, that peace-of-mind is part of your personal utility—a legitimate aspect of “return.”
For Shareholders: Which Side Delivers Better Equity Returns?
If you’re buying bank stocks (public or private), your return depends on:
Growth (loan growth, deposit franchise strength, fee income).
Profitability (NIMs, cost-to-income, ROA/ROE).
Asset quality (GNPA/NNPA, provisioning discipline).
Valuation (P/BV, P/E) at your entry point.
Cycle timing (credit growth wave, interest rate cycle).
Private banks historically often posted higher ROE, better CASA mix, and premium valuations, leading to stronger long-run shareholder returns. However:
Starting valuations can be rich, which caps upside.
Some PSBs have undergone transformations, cleaning up NPAs, improving technology, and enhancing profitability—delivering strong catch-up returns in certain phases.
Investor takeaway: Don’t generalize. Analyze bank-specific metrics, leadership, strategy (retail vs corporate mix), and valuation. Category labels are too broad for equity selection.
Practical Framework: Maximize Your Net Returns
Use this 7-step checklist to decide where you get better returns:
Profile your balances
Average monthly savings balance? Range of surplus cash?
If < ₹50,000 or balances fluctuate: PSB likely better net return due to lower fees.
If > ₹2–5 lakh stable balances and you’ll use sweep: Private can edge out via features & promos.
Account fees reality check
List minimum balance, debit card annual fee, cash transaction charges, branch visit limits, cheque book fees, NEFT/IMPS/UPI costs (often free, but check).
Subtract this from your annual interest to compute net effective return.
Use auto-sweep wisely
If your bank offers sweep, set a threshold slightly above your monthly cash flow needs.
Ensure the breakage penalty or minimum tenor doesn’t negate the benefit.
Shop FD tenors strategically
Look for odd-tenor specials if available.
Ladder multiple FDs (e.g., 3–4 different maturities) to manage liquidity and rate risk.
Senior citizens: optimize the slab
Compare senior add-ons across both bank types; pick the tenor with the best add-on.
Consider monthly/quarterly interest payout if you need income; otherwise cumulative for compounding.
Rewards and ecosystem
If you fly, shop online, or fuel frequently and pay in full monthly, private-bank credit card ecosystems can materially add to returns via rewards.
If you revolve credit, interest costs dwarf rewards—don’t chase points; a simple low-fee PSB setup may be better.
Investments via bank: separate the decision
Choose products on merit (costs, track record, fit with goals), not because a bank RM pitched them.
Consider direct platforms for MFs if comfortable; if not, demand transparent advice from either bank type.
Example Scenarios (How Net Returns Shift)
Scenario A: Young professional with ₹25,000–₹40,000 monthly balance, irregular cash flows
A private bank may impose non-maintenance fees or debit card charges that eat a big chunk of the small interest you earn.
A PSB basic savings account with low fees could deliver higher net return even if the headline rate is slightly lower.
Scenario B: Household maintaining ₹6–10 lakh average balance, comfortable with apps
Private bank with auto-sweep + occasional FD specials + credit card rewards can outperform PSB net returns by a meaningful margin—assuming fees are waived for that balance tier.
Scenario C: Retired couple seeking income, prioritizing safety and branch support
A PSB offering competitive senior FD rates, predictable processes, and low fees may deliver a better risk-adjusted and behaviorally comfortable return.
If a private bank offers a special senior FD at a meaningfully higher rate and you’re comfortable digitally, it can be worth splitting deposits.
Scenario D: SME with volatile cash cycles
A private bank with strong cash management and sweep can reduce idle cash and earn more on surplus; overall treasury return likely higher.
For credit lines under government schemes, a PSB may offer advantageous terms; mixing relationships can maximize outcomes.
Common Myths, Debunked
“Private banks always pay more.” Not always. They often advertise higher slabs and promos, but fees and conditions matter.
“PSBs don’t have competitive rates.” In many cycles and tenors, PSBs do—especially for senior citizens and standard FD slabs.
“Investment returns will be higher if I buy through a private bank.” Returns depend on the product; evaluate costs and suitability, not the distributor’s ownership.
Risk Management & Diversification
Diversify deposits above ₹5 lakh per bank if you are highly conservative, regardless of bank type.
Consider holding two relationships:
A PSB for stable savings, lower fees, and comfort.
A private bank for sweep features, promos, and rewards optimization.
Revisit your setup every 6–12 months as interest rates and fee schedules change.
The Bottom Line
There is no universal winner.
If your balances are small to moderate and you don’t want to obsess over fees and thresholds, a public sector bank often delivers better net returns—because what you don’t lose to charges frequently beats a small interest advantage elsewhere.
If you maintain larger balances, make full use of auto-sweep, chase FD specials, and actively optimize rewards, a private bank can deliver higher effective returns and superior day-to-day convenience.
For investments, focus on the product quality and costs, not the bank’s ownership.
For shareholders, historical market leadership has often favored private banks, but valuation and cycle timing dominate; several PSBs have also delivered strong phases—stock-pick selectively.
Actionable takeaway:
Map your average balances, fee sensitivity, digital comfort, and risk preference.
Use the 7-step checklist to compute your net effective return from each bank you’re considering.
If you want a simple rule of thumb:
Hands-off, fee-averse, small balances → PSB.
Hands-on, balance-rich, feature-optimizer → Private.
Safety-first or large sums → Split across both.

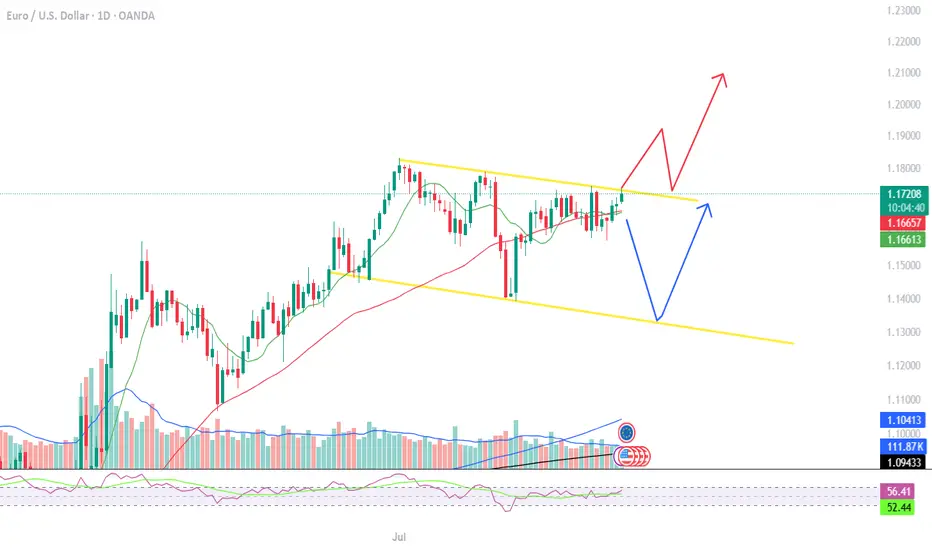
Eurusd next move ,analysis Eurusd has reached resistance in daily time frame .above 1.1735 it will continue the upward momentum .holidng will lead to a fall .both direction are mention

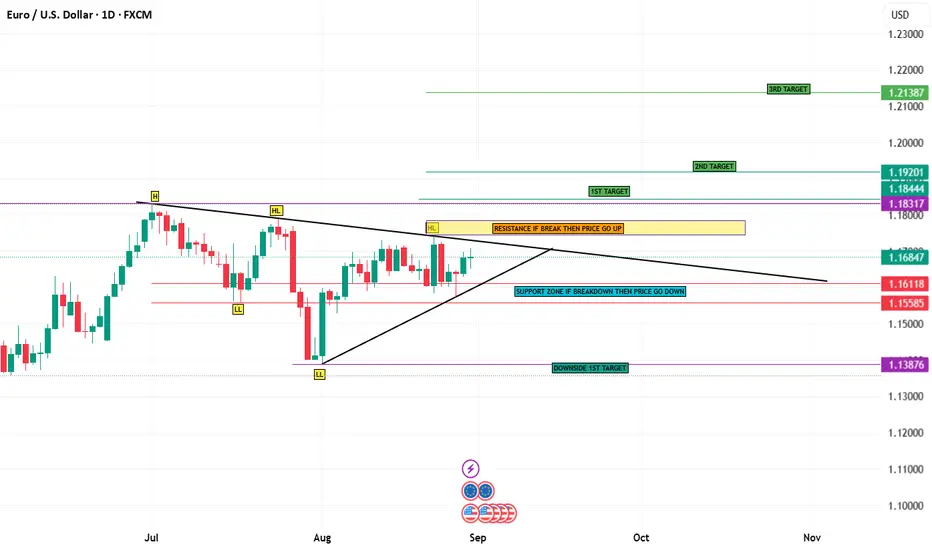
EuroUsd pair chart analysishere eurousd chart analysis with target and support and resistance zone. please trade with sl
below resistance if you buy and if you sell then sl above support zone.
EUR/USD next move This is the EUR/USD 1H chart.
- Price recently broke above the grey demand zone (1.1650–1.1670) and is now respecting an ascending channel.
- After testing the upper boundary near 1.1710, price is pulling back.
- As long as the pair holds above the grey demand zone and the channel support, the bias remains bullish.
- A bounce from this zone could push price back toward 1.1740–1.1760 (upper channel).
- A breakdown below 1.1650 would invalidate the bullish structure and shift bias back to bearish.

EURUSD – Wave 5 Long SetupIdea: EURUSD has completed a clean Elliott Wave (1-2-3-4) structure on the 1H chart and is now setting up for the final Wave (5) push to the upside. Price has broken above short-term resistance and is aiming for the next liquidity zone.
🔹 Entry: 1.16609
🔹 Target: 1.17015 🎯
🔹 Stop Loss: 1.16271 ❌
✅ Reasons for Long Bias:
Clear Elliott Wave progression with Wave 5 in play.
Strong recovery from Wave 4 support zone.
Next resistance aligns with Wave 5 target around 1.1700 psychological level.
Favorable R:R ratio, keeping risk well defined.
⚠️ Risk Management: Always trade with position sizing that suits your account. Stop loss is placed below Wave 4 to protect from invalidation.
📌 Disclaimer
This is purely for educational purposes and not financial advice. Please do your own research before entering any trades.

EUR/USD Buy Setup – Liquidity Sweep + Fractal Break in Play🔹 Technical Outlook
The EUR/USD is showing bullish momentum signs around the 1.16500 zone, a key round figure level.
This price point aligns perfectly with:
1H Order Block
15M Order Block
Recent liquidity sweep during the Asian session
Such confluences strengthen the probability of a bullish move.
🔹 Execution Plan
✅ Entry Zone: 1.16500 (on confirmation after 5 mIns structure break)
✅ Stop Loss: Placed just below the nearest fractal structure low
✅ Target: Dynamic (based on next liquidity pool & market structure shift), aiming for at least 1:2 RR
🔹 Smart Money Concept (SMC) Breakdown
Liquidity Sweep: Asian session’s liquidity cleared, signaling potential for institutional accumulation.
Fractal Break: A clean break of structure after liquidity grab provides confirmation.
Order Blocks: Both higher timeframe (1H) and intraday (15M) OBs align, creating a strong demand zone.
🔹 Why This Trade Matters
Many retail traders get trapped selling into liquidity sweeps.
By waiting for round number confluence + order block validation, this trade setup reduces noise and provides a cleaner entry.
📌 Trading Plan Recap
Watch 1.16500 zone closely.
Wait for fractal structure break post-liquidity sweep.
Enter long with SL below structure, targeting 1:2+ RR.
⚡️ Patience is key. Market manipulation clears weak hands before rewarding disciplined entries.

EUR/USD Short SetupPrice ran out of steam after the rally — liquidity grabbed, rejection confirmed.
Risk defined, execution clean.
If bulls can’t defend, this will bleed.

EURUSD POTENTIAL SETUPEUR/USD – Intraday Plan
Price is pushing back up after recent downside but is approaching a 1H supply zone. My plan is to wait for liquidity sweep above BSL-H1, potentially extending into BSL-H4 / supply zone, before looking for a rejection setup.
If that rejection confirms, I’ll target downside continuation back towards lower levels. Until then, patience is key as buyers may push a bit higher before sellers step back in.
I will update here exact entry and exit if Price gives me my setup

EUR/USD Buy Setup from Support Zone towards 1.1743 TargetEUR/USD 2H Chart Analysis
The chart shows EUR/USD trading within a rising channel, with the price currently retesting the support zone (1.1600–1.1620).
Trend & Structure: Price has been respecting channel support and resistance. Currently, it bounced off the lower boundary of the channel, signaling a potential bullish reversal.
Support & Resistance: Strong support at 1.1600 zone, resistance/target at 1.1743.
Moving Averages: EMA 70 (1.1655) and EMA 200 (1.1648) are near, acting as dynamic resistance. A bullish break above them confirms upside continuation.
Candlestick & Momentum: Long wicks near support indicate buyer interest, suggesting accumulation before reversal.
Risk Management: Stop loss should be placed just below 1.1580 (last swing low).
✅ BUY Setup: From 1.1600–1.1620 support zone, targeting 1.1743 with stop loss below 1.1580.
📊 Strategies Used: Trendline channel, EMA confirmation, support/resistance, candlestick patterns, and risk-reward setup.

I am in buyMarket makes strong demand and also makes flip zone. Above the high build the TL LQ let see what happened


EUR/USD Bearish Trade Idea - Detailed Analysis** IF you like my observation, please boost and follow for more content."
Timeframe: 1 Hour
Entry Price: 1.16177
Stop Loss (SL): 1.16521
Take Profit (TP): 1.15763
Market Overview:
Trend Context: The EUR/USD pair is currently in a clear downtrend as indicated by the price action making lower highs and lower lows.
Chart Setup: The chart shows a descending triangle pattern, which typically signals a continuation of the bearish trend, as the price struggles to break through the resistance at the upper boundary while consistently making lower lows.
Trade Rationale:
Descending Triangle Pattern:
The formation of a descending triangle indicates a strong bearish bias, where the sellers have been consistently defending the resistance level.
The price is making lower highs and has found support at the 1.16177 level, a key point where the downtrend has previously gained momentum.
A breakdown from this triangle often leads to a continuation of the downward movement, reinforcing the bearish outlook.
Entry Setup:
The entry point at 1.16177 is set below the support level, confirming that the price is likely to break through and continue downward.
A close below this level would provide confirmation for the short position, as the breakdown indicates further downward potential.
Stop Loss Placement:
The Stop Loss (SL) is set at 1.16521, just above the last significant swing high and the trendline of the triangle. This allows for some room in case of a false breakout while minimizing risk if the price reverses above this level.
Take Profit Target:
The Take Profit (TP) is set at 1.15763, where the previous support has been observed. This level represents a logical exit point, based on the measured move of the triangle pattern and the market's reaction at this support area.
Risk-to-Reward Ratio (RRR):
This setup offers a favorable risk-to-reward ratio, with a stop loss of approximately 45 pips and a take profit target of approximately 114 pips. This results in an RRR of about 1:2.5, which aligns with a solid risk management strategy for a favorable trade.
Technical Indicators:
Exponential Moving Averages (EMA):
The chart indicates the use of EMAs, which are still in a bearish alignment. The price is below both the 9-period and 20-period EMAs, suggesting that the overall trend is downward.
The EMA setup confirms the bearish momentum, reinforcing the rationale for the short position.

