EURUSD SELL IDEA FOR DAY TRADINGHere We Could Sell On Trendling and Immediate resistance basis for EURUSD to gain 1:2 RR Ratio
Trade ideas

EUR/USD Weakens Amid Trade Tensions and Fed OutlookThe EUR/USD pair continues to decline under the pressure of trade tensions and expectations surrounding the U.S. Federal Reserve's monetary policy. This week, the U.S. decision to impose new tariffs on certain products has heightened market uncertainty, weakening the euro and pushing the price lower.
On the other hand, the continued strength of the U.S. dollar, supported by solid economic data and expectations of a restrictive Fed policy, has worsened the decline of the European currency.
Technically, EUR/USD appears to be breaking through support levels, with the risk of further declines if the current trend continues.

EUR/USD Technical Breakdown – Bearish Structure Confirmed🔍 EUR/USD Technical Breakdown – Bearish Structure Confirmed
The EUR/USD pair has officially broken below a well-established ascending trendline that supported the bullish structure since early May. This technical break is a strong bearish signal, suggesting a potential shift in market sentiment as the pair loses upward momentum.
The pair is now trading around 1.16760, with sellers gaining control after failing to sustain above the 1.1700 region. The breakdown aligns with classic market structure principles, where a clean trendline violation often leads to a continuation move toward the next key support zone.
📍 Target Zone:
The identified downside target is around 1.1500, a critical demand zone that aligns with previous consolidation and potential liquidity pools. This area may act as a magnet for price before any significant reversal occurs.
📘 Trader's Insight:
This setup presents a clear example of a trendline break leading to a bearish continuation pattern. Professional traders may look for retests of the broken trendline for confirmation entries, or short-term rallies to add positions, while maintaining disciplined risk management.
✅ Technical Summary:
Structure: Bearish Breakout
Resistance: 1.1700
Support/Target: 1.1500
Bias: Bearish below trendline

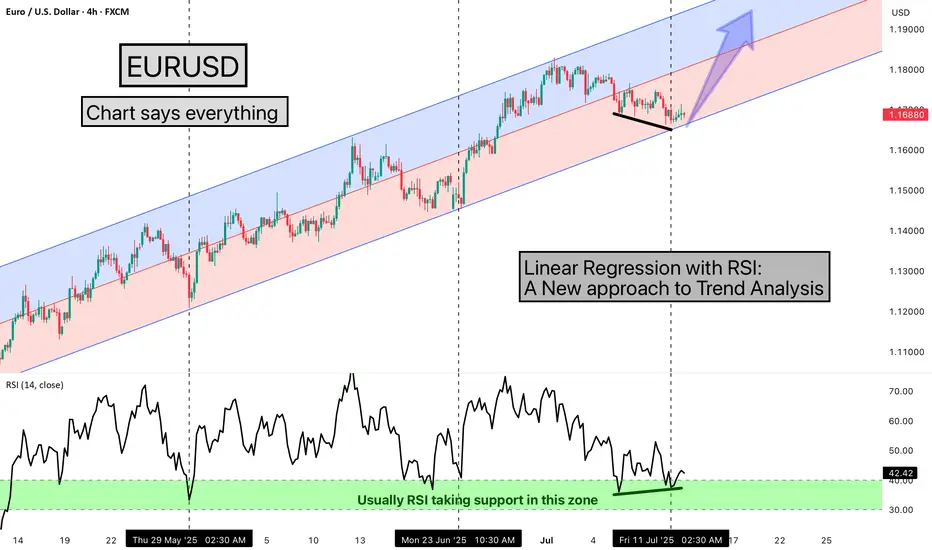
Linear Regression with RSI: A New approach to Trend AnalysisHello Friends,
Welcome to RK_Chaarts,
Today we are going to learn one Method of analysing the chart, here we are using EURUSD chart, and the method we're using is very simple & interesting, We are using the Linear Regression Trend Channel & Relative Strength Index (RSI), What happens in this method, is that we identify a particular zone where the price is making a one-sided move, like if the price is trending upwards, making higher highs and higher lows. We then apply a regression channel to it, and within that channel, we set internal deviation for the upper and lower sides, like 2 or 2.5 or 3 etc., whatever setting it takes.
In this chart, we can clearly see that the 2.5 setting is forming a complete channel, which we've applied for the last two months, from 12th May 2025, when the uptrend started. We've used the 4-hour time frame chart and the RSI. Every time the price hits the bottom of the channel, we can see that the RSI also enters the same zone, between 30-40, and from there, it bounces back.
Currently, the price has again hit the bottom of the regression channel, and the RSI has also gone below 40, between 30-40. And the good thing is that we're seeing a positive divergence in the RSI. So, there's a high possibility that the price might bounce back from here.
It's worth watching what happens next in the market. Nothing is guaranteed here; everything is a game of probabilities. This is one method that we often use, and its results have given us a very good experience. So, let's see what happens next in this chart. This observation is also a good learning experience, which we often encounter, 7-8 times out of 10, in favor of the market, but sometimes it doesn't work, maybe 2-3 times, when the trend changes. So, let's see what happens next.
This post is shared purely for educational purpose & it’s Not a trading advice.
I am not Sebi registered analyst.
My studies are for educational purpose only.
Please Consult your financial advisor before trading or investing.
I am not responsible for any kinds of your profits and your losses.
Most investors treat trading as a hobby because they have a full-time job doing something else.
However, If you treat trading like a business, it will pay you like a business.
If you treat like a hobby, hobbies don't pay, they cost you...!
Hope this post is helpful to community
Thanks
RK💕
Disclaimer and Risk Warning.
The analysis and discussion provided on in.tradingview.com is intended for educational purposes only and should not be relied upon for trading decisions. RK_Chaarts is not an investment adviser and the information provided here should not be taken as professional investment advice. Before buying or selling any investments, securities, or precious metals, it is recommended that you conduct your own due diligence. RK_Chaarts does not share in your profits and will not take responsibility for any losses you may incur. So Please Consult your financial advisor before trading or investing.
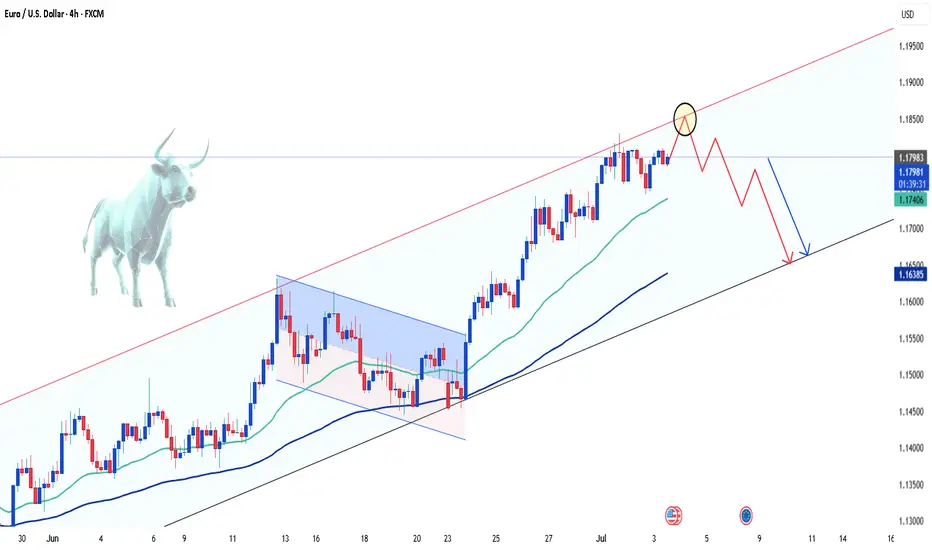
EURUSD: are the bulls taking control?EURUSD is currently trading around 1.1691 and maintaining a bullish structure with consistently higher lows. On the H4 chart, a symmetrical triangle is forming, and price may break out toward the 1.1823 target if it can overcome the resistance trendline.
On the news front, the US dollar has weakened as the Fed has yet to provide a clear signal on rate cuts. Meanwhile, Eurozone economic sentiment is improving, supported by a slight uptick in manufacturing and services data. This reinforces the euro's recovery and keeps upward pressure on EURUSD.
If the 1.1660 support zone holds firm, the upcoming breakout could trigger a strong bullish move. Buyers are waiting for confirmation — are you in the game?

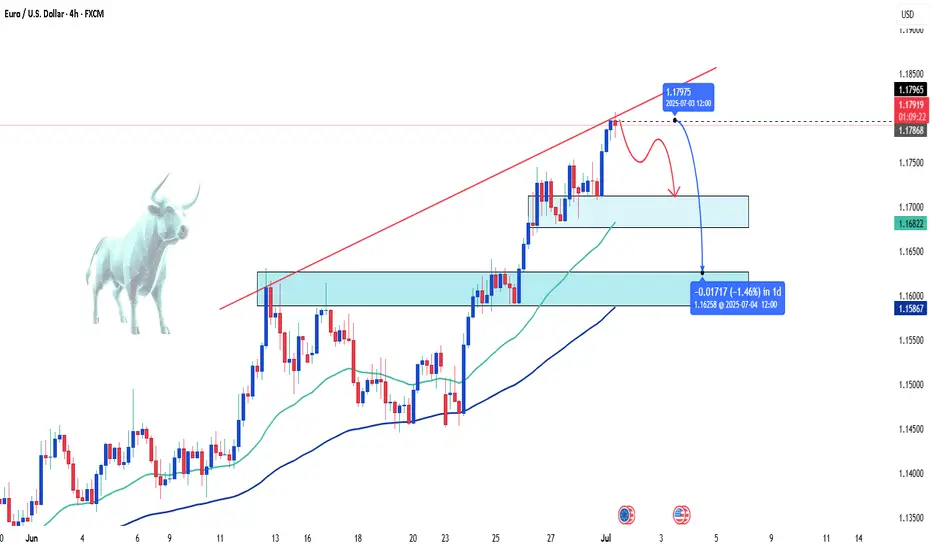
EURUSD – Failed Breakout, Bearish Momentum Takes OverEURUSD attempted to break out of the upper edge of a consolidation triangle but was swiftly rejected around the 1.17450 region, forming a classic “failed breakout” — a pattern that often precedes strong reversals. The pair is now pulling back and appears to be heading toward the 1.16800 support zone.
On the news front, the market is under pressure from rising expectations that the Federal Reserve will maintain higher interest rates for longer, following stronger-than-expected U.S. job data. This has driven a notable recovery in the U.S. dollar, putting downward pressure on the euro. In this context, EURUSD risks a deeper correction if the 1.1700 support fails to hold. Keep a close eye on price action — this pullback could be the start of a new bearish leg.

EUR/USD Slides as Trade Tensions WeighThe EUR/USD pair extended its steady decline on Thursday, approaching the weekly lows as global financial markets remained under pressure from aggressive U.S. tariff announcements. The U.S. President unveiled new tariffs on copper — a key industrial commodity — and signalled upcoming restrictions on the pharmaceutical sector.
A mix of inflation concerns, supply chain disruptions, and continued strength in the U.S. dollar has put the euro under visible pressure. From a technical standpoint, EUR/USD remains in a downward correction phase after pulling back from multi-year highs, with bearish momentum holding firm.
Unless a surprise emerges from economic data or monetary policy shifts, the short-term bias is likely to remain tilted to the downside.

EURUSD – Rebounding from supportEURUSD is forming a small rounded bottom after testing the support zone around 1.1670. If this level holds and price breaks above the nearby FVG area, the pair may continue its recovery toward the 1.1820 target, as shown in the projected path.
Fundamentally, the euro is supported by stronger-than-expected Eurozone retail sales and rising inflation expectations ahead of this week’s CPI data (scheduled for July 10–11). Meanwhile, the USD is under pressure due to uncertainty over U.S.–EU trade policy and a lack of clarity from U.S. trade decisions, which favors a EURUSD rebound.
As long as EURUSD holds above 1.1670, the bullish outlook remains valid. However, a break below this zone could send the pair back toward the 1.1600 area.

Bad News Piling Up – EURUSD Under Heavy PressureEURUSD is slipping fast as a wave of negative news hits the Eurozone. Service PMIs in both Germany and France have weakened, signaling a clear slowdown in the region’s economy. This has sharply reduced expectations of further rate hikes from the ECB.
Meanwhile, Fed officials are doubling down on their hawkish tone, stressing that U.S. inflation remains sticky and interest rates may need to stay higher for longer.
The growing policy divergence between the ECB and the Fed is becoming undeniable – and that’s exactly why EURUSD continues to slide.

EURUSD - Sideways Action Sparks Reversal SpeculationHello traders, what are your expectations for EUR/USD?
Today, EUR/USD continues to move sideways around the 1.1800 mark during Thursday’s European session. The pair is showing signs of caution as the US Dollar gains ground amid optimism over a US–Vietnam trade deal.
From a technical perspective, the bullish trend still dominates as the price remains within an upward channel. However, a short-term pullback could be on the horizon, especially with buying momentum fading as EUR/USD approaches the upper boundary of the channel.
What do you think—could a reversal be forming from this zone?
Drop your thoughts in the comments!
Happy trading, everyone!
EURUSD – Rebounding from Trendline, Targeting 1.18500EURUSD has bounced off the ascending trendline and key support zone around 1.16900. The price action suggests a potential continuation of the uptrend, with the next target near the 1.18500 resistance zone.
The current structure is forming higher lows, indicating bullish momentum. As long as the price holds above 1.16900, the bullish scenario remains valid.
From a fundamental perspective, the euro is supported by expectations that the ECB will keep interest rates steady, while the USD faces pressure if the upcoming FOMC minutes strike a less hawkish tone. This creates a favorable backdrop for the EURUSD uptrend.

Caution Prevails as EUR/USD Tests Downtrend LimitsToday, EUR/USD continues to hover around 1.1780, following a mild downtrend amid ongoing economic uncertainty. With a light economic calendar and looming deadlines surrounding U.S. trade tensions—particularly with Europe—traders are steering clear of aggressive positions.
Despite the structurally weak U.S. dollar due to expectations that the Federal Reserve may cut interest rates, there is no clear bullish momentum for the euro, largely because of mixed signals from the European Central Bank (ECB).
As long as the pair fails to break through the technical resistance near 1.1760—the upper boundary of the current price channel—sellers maintain the upper hand.

EURUSD LongPrice is currently in an uptrend. Price retested an orderblock and a fair value gap on the 30 min timeframe. Take profit should be set at 1.17850 and stoploss at 1.17340 and this should give you a nice 1:2 risk to reward.

EUR/USD: Waiting for the Next Move – What’s Your Take?Hello traders, let’s dive into EUR/USD with Kevinn!
📈 Market Update:
The euro is currently under pressure following dovish remarks from ECB officials, which have increased expectations that interest rates will remain unchanged for a prolonged period. Meanwhile, the US dollar is showing mild weakness as markets begin pricing in potential Fed rate cuts later this year — though the shift hasn't been strong enough to trigger a breakout in EUR/USD.
Upcoming CPI reports will be crucial in shaping future monetary policy expectations and could define the short-term direction of this currency pair.
🧠 Personal Take:
EUR/USD is trading around the 1.0720 zone, with market momentum currently lacking. A short-term pullback toward the support zone near the 34 and 89 EMA is possible. However, from a technical standpoint, the long-term bullish structure remains intact — at least for now.
So what do you think about EUR/USD's direction? Drop your opinion below!
EUR/USD Stuck in Tight Range as Tariff Deadline LoomsEUR/USD remains confined within a narrow range around 1.1780, continuing its sideways movement. Market participants are adopting a cautious stance, and the pair’s upside potential appears limited as the U.S. tariff deadline approaches.

Is EURUSD About to Reverse? Key Support in DangerHello traders, what are your thoughts on EURUSD?
Today, EURUSD is facing a clear risk of a downside correction following stronger-than-expected Nonfarm Payroll data. This immediately boosted the US dollar, threatening the pair’s recent bullish momentum.
On the H4 chart, a CHOCH (Change of Character) pattern has just formed, signaling weakening buying pressure. If the price breaks below the 1.1745 support, the following BOS (Break of Structure) sequence could confirm a shift to a bearish market structure. With the Fed likely to maintain higher interest rates for longer and delay rate cut expectations, the USD stands to benefit further.
What do you think — could this be the start of a major reversal?

EURUSD SHORT - 15M/1HFOREXCOM:EURUSD
Hello traders , here is the full multi time frame analysis for this pair, let me know in the comment section below if you have any questions, the entry will be taken only if all rules of the strategies will be satisfied. wait for more Smart Money to develop before taking any position . I suggest you keep this pair on your watchlist and see if the rules of your strategy are satisfied...
Keep trading
Hustle hard
Markets can be Unpredictable, research before trading.
Disclaimer: This trade idea is based on Smart money concept and is for informational purposes only. Trading involves risks; seek professional advice before making any financial decisions. Informational only!! !

EURUSD: Sideways Consolidation Before Directional BreakEURUSD is currently moving within a clear sideways range between 1.16400 and 1.18400, positioned just above the ascending channel line. Recent price action shows consolidation, with lower highs forming near 1.18400 while support holds firmly.
If price breaks below the range, a retest of the channel support around 1.16400 is likely. On the other hand, a bounce from current support may lead to another attempt toward the upper resistance. Traders should wait for a clear breakout signal before entering in the new trend direction.

EURUSDHello Traders !
The EURUSD formed Fair Value Gap signify an imbalance in the market, represents a price range on a chart where there's an imbalance between buyers and sellers, typically resulting from a sudden and strong price movement ! So, I expect a bearish move📉

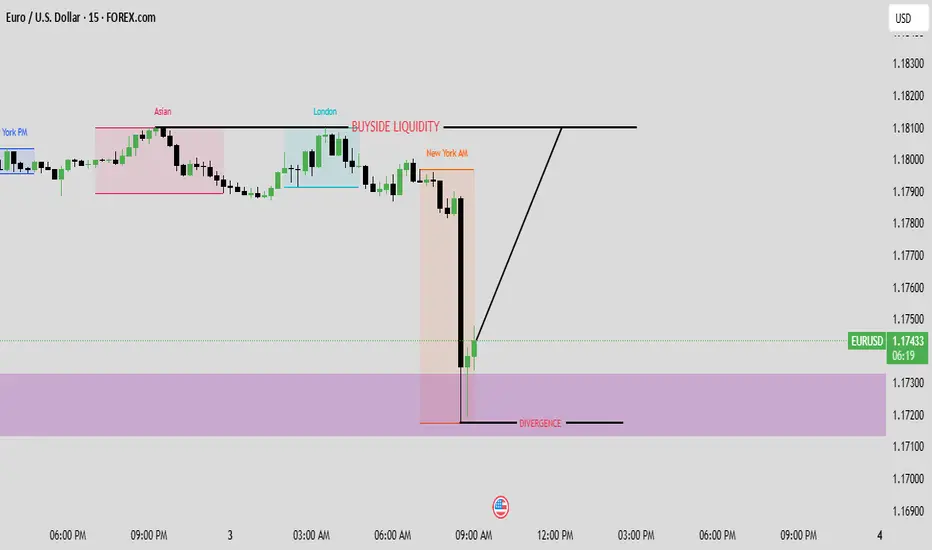
NONFARM PAYROLL EURUSD 15MINAS we have taken sellside liquidity and there is buyside liquidity on london seesions high we can expect market to move higher it has also made divergence so its quite poosible it will go higher.
keep following me for more updates.
Non farm payroll Analysis EURUSD 1HAs market have made equal lows during aisan session , we can expect that it will be bearsih during london session making low and can take support from 1 h order block that i have marked we can see bullish run during non farm payroll timing ....for further updates keep following me.

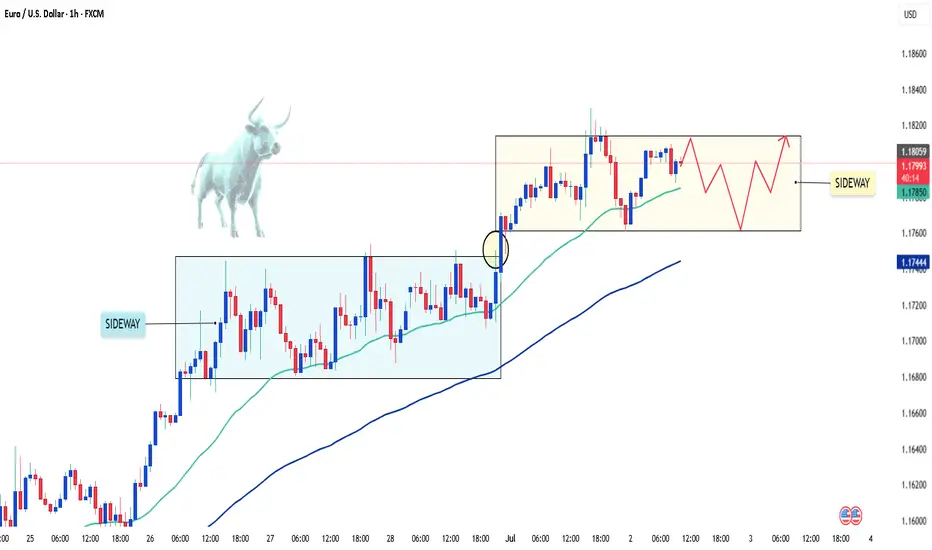
EURUSD: A Pause Before the Next Wave?After a strong breakout at the end of June, EUR/USD surged but has since entered a tight consolidation range. But don’t be discouraged — this could simply be a breather before the next big move!
On the chart, the bullish trend remains intact as price stays above key EMAs. Buyers aren’t backing down, and the market seems to be "catching its breath."
If EUR/USD breaks out of the current sideways zone around 1.1810, we could see another bullish leg aiming for higher levels.
EURUSD / FIBER MONTHLY ANALYSIS 01-JUL-2025 @ 1.1779LTP 1.1779
Supports: 1.1434/1.1055
Base Supports: 1.016/0.9534
As long as 1.1434/1.1055 holds support, we will see 1.1919/1.23 in the near term.
Other targets: 1.2577, 1.2970-1.3234-1.3655, 1.42, 1.47 long term.
My view: Buy on dips.
