EUR USD Weekly Free Analysis (28-06-25 to 05-07-25)EUR USD
In early July 2025, EUR/USD may start falling from the current high levels. This is because the US dollar is expected to get stronger due to upcoming positive economic data (like jobs and services reports) and the Federal Reserve staying firm on high interest rates. At the same time, the euro could weaken if the European Central Bank turns more cautious because of slower growth in the Eurozone. This difference in economic strength and central bank policy (called divergence) usually pushes EUR/USD lower. Also, if global markets turn risk-off, more investors may shift to the safer US dollar, adding pressure on the euro.
USDEUR trade ideas

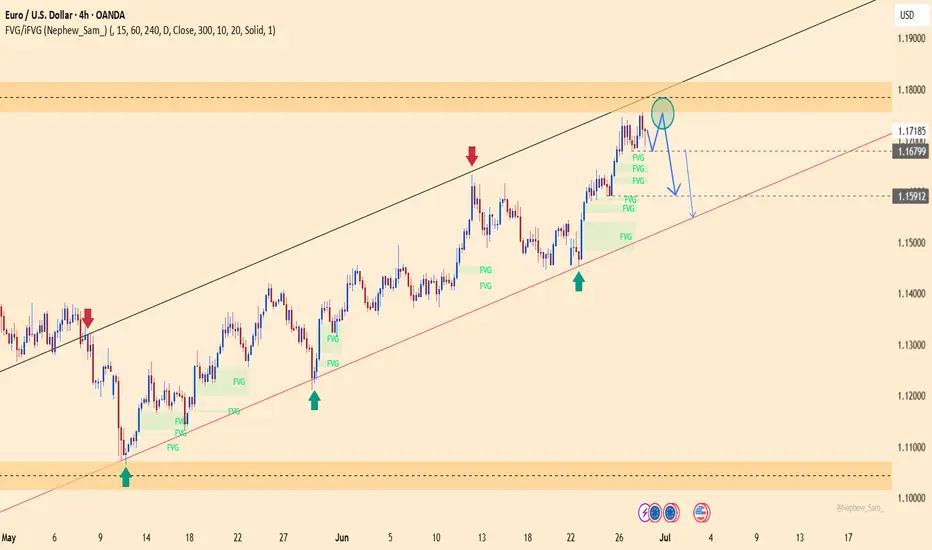
EURUSD – Bearish Pressure Resumes After Rejection at 1.17500EURUSD has rejected the 1.17500 resistance zone and is now forming lower highs on the H4 chart, signaling weakening bullish momentum within the ascending channel.
Stronger-than-expected Core PCE data from the US reinforces the Fed’s cautious stance, keeping the USD strong. Meanwhile, political rumors about Trump potentially replacing Powell have triggered market volatility but still support the dollar in the short term.
As long as price fails to break above 1.17500, EURUSD is likely to decline toward the 1.15900 zone. A bullish scenario would only be validated if price closes above 1.1760.
EURUSD Bulls in Charge – Can They Push Higher?EURUSD continues to demonstrate strength, maintaining a clear uptrend on the H4 timeframe. After breaking above the former resistance zone near 1.1600, price surged and is now consolidating around 1.1706. This breakout confirms strong bullish momentum, especially following a long period of consolidation.
That said, the area around 1.1730–1.1740 is showing signs of minor rejection, with a potential double-top pattern emerging. However, this appears to be a healthy pullback within the broader bullish trend.
The most reliable support is currently found at 1.1620, which also aligns with the EMA 34 — a dynamic level that has acted as a pivot throughout this rally.
As long as price remains above 1.1620, the bullish trend remains firmly intact.

Eurousd : If price break this trendline then you plan for short High probability setup ...... the trendline is very crucial give attention here...🤌🔥

EURUSD Breaks Free – Is the Rally Just Beginning?After several days of bearish expectations, EURUSD has finally regained its bullish momentum. The pair surged sharply, breaking out of the descending channel and climbing from 1.146 to 1.162 at the time of writing.
The current resistance zone is being tested, yet buyers remain supported by strong technical factors, notably the stability of EMA 34 and 89.
On the fundamental side, expectations that the Fed will keep interest rates steady—reinforced by dovish remarks from Chair Powell before Congress—alongside a weakening USD due to easing geopolitical tensions and reduced euro-hedging by European funds, have fueled fresh demand for the euro.
What about you—do you think EURUSD will continue to rise or pull back from here?

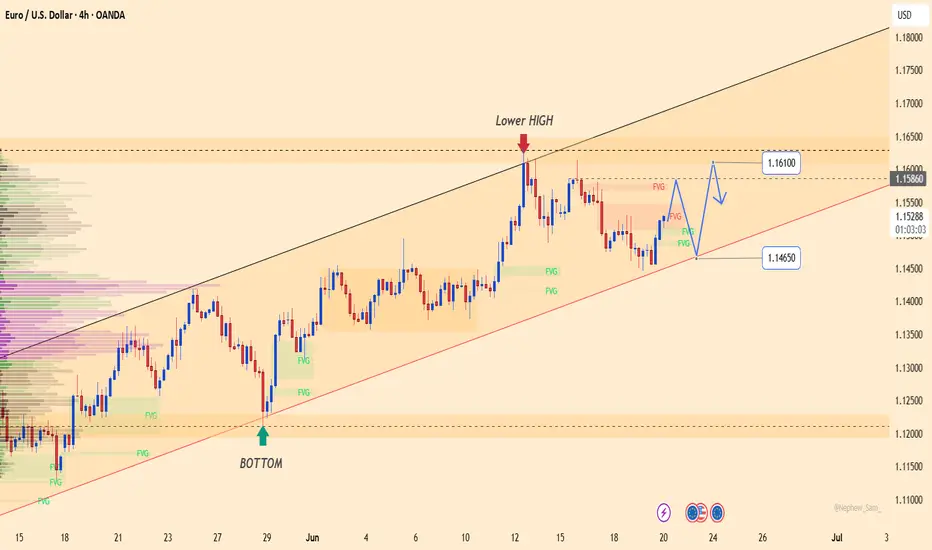
EURUSD – Short-term pullback before potential recoveryOn June 21, EURUSD edged down 0.12% to close at 1.15222 following mixed PMI data from the Eurozone. The H4 chart shows that price remains within the main ascending channel, forming a lower high around 1.16300 — a signal of a short-term corrective phase.
Currently, EURUSD is consolidating sideways near an unfilled Fair Value Gap (FVG) resistance zone. If price fails to break above this level, a short-term drop toward the ascending channel support at 1.14860 is likely, before a potential rebound toward 1.15860 and possibly 1.16300.
Short-term strategy: Watch price action near the trendline support. If clear bullish rejection appears, this could offer a buying opportunity in line with the broader trend, targeting a recovery to recent highs.

EUR/USD Bullish Continuation Analysis EUR/USD Bullish Continuation Analysis 🚀💶
📊 Chart Summary:
The EUR/USD pair is demonstrating a strong bullish structure with consistent higher highs and higher lows. Recent price action shows a breakout above the 1.16386 resistance level, now acting as support 🛡️. The market is currently retracing and might retest this new support zone before continuing its upward move toward the target.
🔍 Key Observations:
🔸 Bullish Structure:
Multiple bullish impulses have formed a clean staircase pattern (🔼⬆️), indicating sustained buying momentum.
🔸 Support Zone 🟦 (1.13200 - 1.14000):
This zone has been tested multiple times, confirming its strength and the base of this bullish rally.
🔸 Breakout & Retest 🟠:
Price broke above the 1.16386 resistance level, pulled back slightly (highlighted by the orange circle), and now looks ready for a potential continuation to the upside.
🔸 Target 🎯: 1.18010
A clear target has been set based on measured move or resistance projection. If the price respects the current structure, we may see a continuation toward this level.
✅ Trade Outlook:
Bias: Bullish 📈
Entry Zone: Around 1.16386 (upon bullish confirmation)
Target 🎯: 1.18010
Invalidation ❌: Break below 1.1600 with bearish momentum
🧠 Technical Tip:
Always wait for confirmation on the retest before entering. Wick rejections or bullish engulfing candles at the support zone can provide additional entry confidence. 🔍✅

EUR/USD Weekly Technical Analysis – Testing Major Resistance📊 EUR/USD Weekly Technical Analysis – Testing Major Resistance 🔥📈
The EUR/USD pair is exhibiting a strong bullish momentum on the weekly timeframe, currently trading at 1.16562, and fast approaching a key resistance zone.
🔵 Key Observations:
📌 Resistance Zone:
Blue shaded area between ~1.16500 - 1.19000 is a major resistance level, historically tested in mid-2021.
A breakout above this zone could trigger a long-term bullish reversal toward 1.22793 (next major resistance marked by red arrow 🔴).
📌 Support Levels (Yellow Lines):
1.12821 🟡 – Previous minor resistance, could act as immediate support.
1.10543 🟡 – Key support from consolidation zone.
1.06775 & 1.04733 🟡 – Strong support levels during 2023-2024.
1.02063 & 0.96960 🟡 – Long-term base zones (2022 lows), showing double bottom formation (green arrows 🟢).
📌 Structure:
Formation of higher lows and higher highs, indicating bullish structure.
Recent breakout above consolidation range confirms momentum strength.
📌 Indicators (Bottom Right):
Suggest volatility and possible impact of economic or geopolitical events. ⚠️📅📌
⚠️ What to Watch For:
Rejection from Resistance could trigger a correction toward 1.12821 or lower.
Breakout above Resistance would expose 1.19000 → then 1.22793 (major target 🎯).
Weekly Close Above Resistance will be crucial to confirm the breakout.
📈 Bias: Bullish (Short to Mid-Term)
🧠 Strategy Tip: Traders may look for bullish continuation on breakout and retest above resistance, or short-term pullback entries around support if rejection occurs.

EURUSD ANALYSIS
Weekly bias is bearish
Daily bias is up to liquidity point 1.16321
Then it will swipe the weekly candle and then give big push on bearish side beacause weekly bias is not done yet

EUR/USD Potential Rejection from ResistanceTechnical Overview:
The EUR/USD chart exhibits signs of a bearish reversal pattern forming near a key resistance zone (1.15800 - 1.16000), highlighted with repeated rejection wicks (🔴 red arrows). Price is currently trading at 1.15222, after failing to hold above the neckline of the rounded bottom pattern.
🔍 Key Observations:
🔺 Resistance Zone: Strong resistance has been confirmed multiple times (red arrows), indicating sellers are active at the top.
🟠 Double Top / Head & Shoulders Behavior: Price action shows topping formations (highlighted with orange circles), suggesting exhaustion of bullish momentum.
📉 Bearish Breakdown Possibility:
Price rejected near neckline and is showing bearish candle formations.
Breakdown from the current consolidation zone could push price toward the target zone at 1.14491, marked in purple.
This aligns with previous support structure, reinforcing a technical downside projection.
🔻 Support Zone: Around 1.13800 - 1.14000 is a strong area of demand and may act as the next bounce point if the bearish move continues.
📐 Chart Pattern Structure:
Rounded bottom formed earlier, but the failure to continue higher and breakout suggests a false breakout trap for buyers.
Downward sloping trendline broke, but now price is struggling to sustain above previous highs.
📌 Conclusion:
⚠️ Caution for bulls as price shows signs of weakness at resistance. A move below 1.15000 may initiate further downside toward 1.14491 and possibly lower. Short-term traders can watch for confirmation candles near this zone for entries.
📅 Short-Term Bias: Bearish
🎯 Target: 1.14491
⛔️ Invalidation: Strong breakout above 1.16000

EURUSD weekly viewNotes
1. Weekly candle is an inside candle also an indecision candle, breaking either high or low can decide the trend.
2. No FVG creation in last week in Day TF
3. Protecting last week high can push down EURUSD

EURUSD – Rejected at Lower High, Bearish Bias BuildsEURUSD has printed a clear lower high near the 1.16100 resistance zone, failing to reclaim the previous swing high. Price is now retreating, approaching the dynamic trendline support intersecting with FVG zones around 1.14650. The structure suggests potential for a short-term bounce—but as long as price remains below the 1.15860–1.16100 resistance zone, the broader setup leans bearish.
On the macro side, the ECB’s dovish tilt—hinting at rate cuts due to subdued inflation—has weighed heavily on the euro. Meanwhile, the Fed maintains its hawkish stance, reinforcing dollar strength, especially amid renewed geopolitical tensions that are pushing USD further as a safe haven.
If the ascending trendline fails to hold, we may see an accelerated decline toward the 1.13800 area. Watch for a failed retest of 1.15860 as confirmation for short entries.
Eurusd Liquidity 15 min analysisEurusd next liquidity areas where we can expect marrket to reach and then reverse ....just keep following me fot posts like these and stay updated

EURUSD H1 – Potential Buy Opportunity
📈 **#EURUSD H1 – Potential Buy Opportunity**
We’re closely watching the **H1 order block zone between 1.1482 – 1.1495**.
👉 If price **taps into this zone** and shows a **bullish rejection**,
👉 And we get a **bullish H1 candle closing above 1.1530**,
✅ Then we may plan a **Buy Setup** with:
🎯 **Target**: 1.16185
🛡️ **Stoploss**: 1.1145
Let’s wait for proper confirmation before entering!

EUR/USD 4H Analysis – Bearish Outlook with Key Levels📉 EUR/USD 4H Analysis – Bearish Outlook with Key Levels 📊
🔍 Overview:
The EUR/USD pair on the 4-hour chart is showing signs of a potential bearish reversal after testing a strong resistance zone near 1.16000. Price action has rejected this area twice (🔴), confirming it as a significant supply zone. The chart now suggests a descending move toward the strong support zone around 1.12000.
🔑 Key Levels:
🟡 Resistance Zone: 1.15700 – 1.16000
Multiple rejections indicate strong selling pressure.
🟦 Mini Support: Around 1.14550
A minor level where price could react short-term, but not a major barrier.
🔻 Mid-Level Target: 1.13653
Potential bounce zone before continuation downward.
🟥 Strong Support Zone: 1.11500 – 1.12200
Previously held as a launch point for a major rally in May; likely to be tested again.
📈 Scenario Outlook:
Bearish Path Expected:
Price is forming a series of lower highs and appears to be losing bullish momentum.
Target Path (Blue Arrows):
A potential drop toward the 1.13653 level is expected, followed by a deeper drop toward the strong support.
Rebound Possibility:
If the strong support holds, we could see a strong bullish bounce 🔄, potentially creating a longer-term buying opportunity.
💡 Conclusion:
EUR/USD is currently in a correction phase. Traders should watch for a confirmed break below 1.14550 for bearish continuation 📉. A drop to the 1.12000 zone may offer a high-probability reversal setup 📊📍.
🔔 Trading Tip:
Use caution around mini support; aggressive sellers may enter on any weak bounce. Wait for confirmation before entering positions. 🧠📉

EUR/USDPrice action trading is a methodology in financial markets where traders make decisions based on the actual price movements of an asset over time, rather than relying heavily on technical indicators or fundamental analysis. It involves observing and interpreting patterns and trends in price charts to predict future price movements.

EUR/USD Bullish Reversal Breakout Pattern EUR/USD Bullish Reversal Breakout Pattern 🚀📈
📊 Technical Analysis Summary:
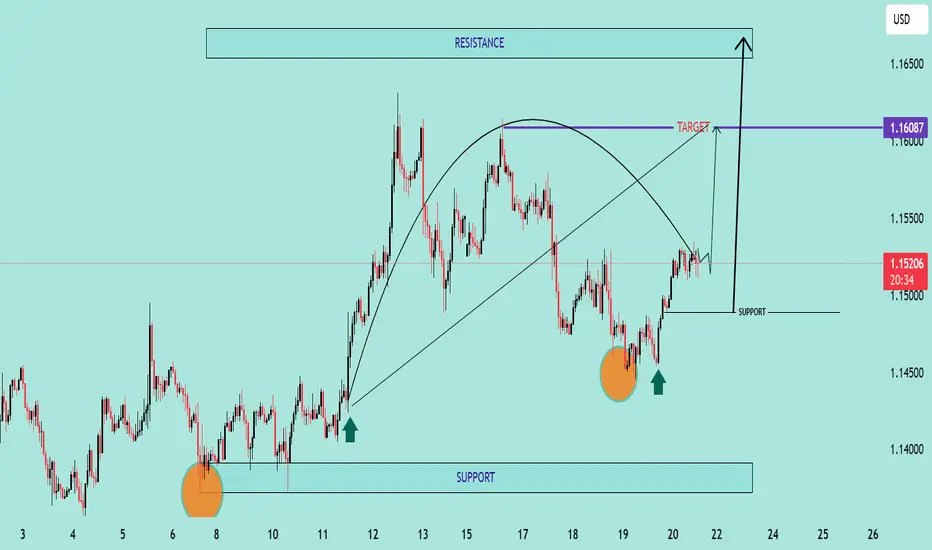
The chart illustrates a strong bullish reversal pattern forming on the EUR/USD pair:
🔹 Double Bottom Formation (🔶🔶):
Two clear bottom zones are marked with orange circles near the 1.14400–1.14500 area, indicating strong buying interest and support.
The second bottom confirms the double bottom pattern, often a precursor to an upward trend.
🔹 Support Zone (📉):
Firm support around 1.14450, as highlighted on the chart.
Price has respected this zone twice, bouncing back with bullish momentum each time.
🔹 Neckline Breakout (🔼):
Price is approaching the neckline zone at 1.16087, which acts as the bullish target.
A break and close above this neckline will confirm the reversal and open the way toward the resistance zone around 1.16500.
🔹 Projected Move (🎯):
If the neckline breaks, price is expected to surge towards 1.16500, aligning with the historical resistance.
This move completes the measured target projection from the double bottom structure.
🔹 Bullish Structure:
Higher lows and strong bullish candles are reinforcing the uptrend momentum.
Curved trajectory shows accumulation followed by a breakout phase.
📌 Key Levels to Watch:
Support: 1.14450 – 1.14500
Neckline/Target: 1.16087
Resistance: 1.16500
🛑 Invalidation:
A strong breakdown below support (1.14450) would invalidate this bullish setup.
✅ Conclusion:
EUR/USD is exhibiting a textbook bullish reversal setup with a potential breakout above 1.16087 likely to trigger further upside toward 1.16500. Ideal scenario for bullish entries on
EURUSD – Weakening Trend, Risk of Deeper CorrectionThe EURUSD pair is gradually losing its bullish momentum after failing to hold above the 1.1510 level, forming a series of lower highs. The recent decline is dragging the price back toward the long-term ascending trendline. If buyers fail to defend the support area around 1.1380 — a confluence of the trendline and the most recent swing low — the previous uptrend structure could be invalidated.
On the news front, the euro is under pressure following cautious remarks from the ECB, while recent PMI and inflation data from the Eurozone suggest slowing economic growth. Meanwhile, the Federal Reserve in the US maintains a hawkish stance, reinforcing USD strength and applying double pressure on EURUSD.

EUR/USD Potential Reversal from Resistance Zone –Bearish OutlookThe EUR/USD pair has been trading within a well-defined ascending channel for several weeks. Price recently tested a strong resistance zone near 1.15850 – 1.16000, which aligns with the upper boundary of the channel and a previously marked supply area.
Key observations:
The price action shows signs of rejection from the resistance zone with a potential double-top or fakeout pattern forming.
A projected bearish trajectory is marked, suggesting a possible break below the channel support.
Immediate bearish targets are set at key demand zones around 1.14500, 1.12500, and further down to 1.10500.
A large red arrow indicates the strong downside bias if the price confirms the breakdown.
Conclusion:
If EUR/USD fails to sustain above the 1.15850 resistance zone and breaks below the ascending channel, a strong bearish correction is anticipated. Traders should watch for confirmation of the breakdown before entering short positions.

EURUSD ShortPrice is in a downtrend. Price broke structure and is moving to the downside. Price also formed a orderblock on the 30min timeframe. Price retested the oredrblock and the 30min FVG. takeprofit at 1.14750 and the stoploss 1.15190.

EUR/USD Bearish Reversal in Channel EUR/USD Bearish Reversal in Channel 📉🔻
📊 Technical Analysis Overview:
The EUR/USD pair is showing clear bearish pressure after hitting a key resistance zone near 1.16500, which aligns with the upper boundary of the ascending channel 📐.
🔺 Resistance Area:
Price reacted strongly to the 1.16500–1.16000 resistance zone (marked with red arrows ⬇️).
Double rejection near this level confirms seller dominance.
📉 Bearish Structure:
Price is forming lower highs, suggesting weakening bullish momentum.
The current pattern implies a potential head and shoulders or rising wedge breakdown.
🎯 Target Levels:
Primary Target: 1.13560 🔽 (short-term key support marked in purple).
Extended Target: 1.12000–1.12500 zone 🧲 (major support area at the lower boundary of the channel).
📎 Support Zone:
Historical bounce region around 1.12000–1.12500 is a strong demand area.
🔍 Conclusion:
If price breaks below 1.13560, it opens the path for a deeper drop toward the broader support range. Traders should monitor for confirmation signals below that level 📉🚨.
⚠️ Recommendation:
Bearish bias remains valid unless price breaks back above 1.15500. Look for pullbacks for short entries. Tight risk management advised! 💼📉


EURUSD NEXT POSSIBLE MOVEVANTAGE:EURUSD
🔵 EUR/USD | 17 June 2025 | ICT Intraday Outlook
---
🧠 Market Context:
The market opened today below the previous day’s midrange, suggesting a neutral to bearish tone in early sessions.
We are currently within a consolidation between PDH and PDL, and watching for a liquidity sweep + BOS setup in either direction.
📌 Buy Scenario (Bullish Bias):
If price breaks above 1.14312 (previous structure) and sweeps buy-side liquidity, then:
Expect a retracement back into the FVG or OTE zone between 1.14100–1.14200
Confirmation of displacement + bullish order block around this zone could signal a long opportunity.
🎯 Buy Target: Retest of PDH 1.14577, extended target toward 1.14780 and above.
📌 Sell Scenario (Bearish Bias):
If price breaks below 1.13715 (PDL), expect:
Sell-side liquidity sweep, leading to a displacement candle
Wait for price to retest 1.13700–1.13820 area (M15 OB/FVG)
If lower high confirms, watch for short setups
🎯 Sell Target: Drop into the sentimental level of 1.13420
🔑 Summary:
Direction Trigger Break Level Entry Zone Target
Buy Break & sweep 1.14312 1.14100 – 1.14200 (OTE) 1.14577 → 1.14780
Sell Break 1.13715 1.13700 – 1.13820 retest 1.13420 (sentiment)
📊 Market Model: ICT Liquidity Sweep + Displacement + Entry Model (FVG or OB)
📅 Session: London to NY overlap
