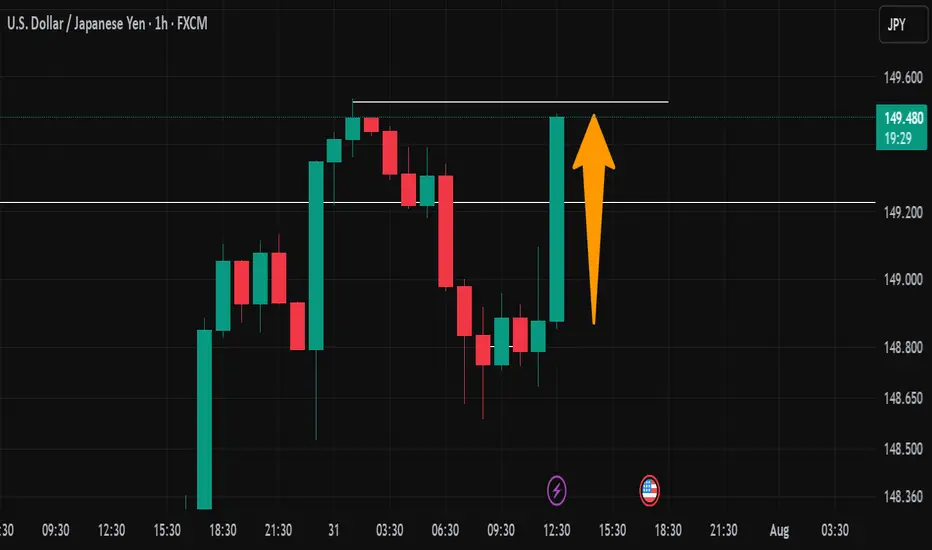
USDJPY- London session consolidation breakout entryUSDJPY- London session consolidation breakout entry
Price has made a H&S pattern. Target to pattern completion.
Also fib level rejection on the higher tf.
London open entry
USDJPYTMSP trade ideas

USDJPY POTENTIAL SETUPPrice has pulled back into the H1 Fair Value Gap (FVG) and is showing signs of support. As long as this zone holds, the bias remains bullish with potential continuation towards the 147.93 liquidity level.
A clean rejection from the FVG would strengthen the case for further upside, while a breakdown below could invalidate the setup.
I will post here exact entry and exit if Price gives me my setup


USD/JPY Bullish Continuation Towards 149.00This USD/JPY (1H) chart shows a bullish setup:
Price is respecting the ascending channel (support & rejection lines).
Currently, price is near the FVG (Fair Value Gap) zone between 147.257 – 147.526, suggesting a possible retracement before continuation upward.
Both EMA 70 & EMA 200 are aligned closely, acting as dynamic support.
A long entry is expected from the FVG zone with a target point at 148.975 – 149.002.
Stop-loss lies below the FVG around 147.251.
👉 Overall bias: Bullish continuation towards 149.00 after filling the FVG.

USD/JPY SD + OTE + PD Array AnalysisStandard Deviation Entry Model on FOREXCOM:USDJPY
1. Inducement on 15min TF
2. Targets + Mini reversal zones marked out
3. 1H PD Array (FVG) Equilibrium tapped
4. Entry Triggered
5. 1st Target HIT
6. Waiting for Standard Deviation ultimate target to hit
I'll like to know more your thoughts on this!
Share your analysis as well!

XAU/USD SD + OTE + Fractal Reversal TradeHey traders!
Here you can see all the trades taken by me in accordance with some major concepts of ICT.
1. OTE - Optimal Trade Entry
2. SD - Standard Deviation
3. Fractal Nature - If you can't find a pattern on the HTF, you'll surely find something on the LTF and vice versa. For example:
- The SELL entry over here, we had an FVG on the 5 min TF , there was no other valid level to short the markets.
- The other BUY Entries were taken on HTFs , and gave us very good targets as well!
Standard Deviations when combined with PD arrays , work like a charm and can be used as targets for LTF trades and reversals for HTF trades.
Hope you learned something today!
Share your analysis as well in the comments!

USDJPYIt looks like price completed its objective just before Friday’s news release, after which USD dropped sharply. From a technical perspective, structure has flipped from bullish to bearish. A clean correction to the upside into the 148.0 supply zone followed by a drop would make perfect sense. I’ll be watching to see if this develops into a swing move.

Bullish USDJPY (Long Position)Time Frame: 1-Hour
Trade Direction: Bullish
Entry Price: 148.629
Target Price: 149.262
Stop Loss: 148.108
Risk-Reward Ratio: ~2.3:1
1. Chart Analysis:
The price action has been respecting a strong ascending trendline (blue line) indicating a consistent upward momentum over the past several hours.
Price has recently bounced off the trendline and is approaching a resistance zone near 148.6, showing potential for a continuation upward towards 149.262.
Support Level: The price has previously found support at the 148.1 level, confirming a solid demand zone in the market.
2. Indicator Support:
Exponential Moving Averages (EMA): The price is currently trading above both the 9-period and 20-period EMAs, which is a bullish sign indicating upward momentum. The EMAs are also in alignment, further supporting the bullish case.
Volume Trend: There is an increase in volume accompanying the recent bullish price action, confirming strong buying interest and supporting the idea of a potential breakout towards the target.
3. Risk Management:
The stop loss is placed just below the recent low at 148.108 to provide a reasonable buffer against any price retracement, keeping the trade within an acceptable risk range.
The target is set at 149.262, just below the key resistance level, ensuring that we capture the full potential of the current trend while minimizing the risk.
4. Trade Setup Logic:
This setup is based on the continuation of the uptrend, with strong support from both the price action and indicators. The price action has successfully bounced from the trendline, confirming a potential continuation move towards higher prices.
The target lies near a resistance zone, making it a logical point for potential profit-taking.
5. Conclusion:
The overall market structure and indicators are aligned in favor of a bullish position, providing a high-probability setup. With a clear risk-reward ratio, this trade offers a favorable risk profile and a solid chance for profit.

UsdJpy raising as JP225 hit ATH - #USDJPY #FedWatch #SwingTraderVANTAGE:USDJPY USD/JPY —
Risk-On Mood Meets Key Support Test
Japan’s stock market is surging, the yen’s safe-haven shine is fading, and USD/JPY is back testing a critical support zone. Will bulls reclaim momentum or will macro headwinds hold them back?
Weekly Analysis — USD/JPY & Macro Update
During the week of Aug 4–8, Japan’s stock market (Nikkei 225) rallied strongly on foreign inflows and improving investor sentiment.
In theory, when Japanese equities surge, the yen tends to weaken as capital shifts toward risk assets — a move that generally supports USD/JPY upside.
However, last week USD/JPY mostly consolidated, with only a modest USD gain versus the yen, suggesting buying momentum had not fully kicked in.
Entering the week of Aug 11, USD/JPY has resumed its upward trajectory, maintaining the long-term bullish structure visible on the monthly chart. The key support zone has shifted upward from 128–138 (2023–2025) to the current 148–145 range.
Note: The lower bound of the highlighted box has moved up from ~145 to ~146. Short-term swing traders could look for opportunities toward the 151 resistance area. As always, respect strong support zones for precise stop-loss placement, and keep position size within prudent risk limits (max 8% of total capital).
Key Fundamental Drivers (CNBC)
1️⃣ Dollar under mild pressure — Nikkei rally signals a “risk-on” environment, typically weakening the yen’s safe-haven appeal and supporting USD/JPY.
2️⃣ US labor data in focus — Following last week’s weak NFP, weekly jobless claims ticked higher, pointing to potential labor market softness.
3️⃣ Euro gains slight support — Hopes of ending the Russia–Ukraine war lifted sentiment toward European assets.
4️⃣ Asian equities shine — Regional stock indices (e.g., Nikkei up 2–3%) reinforce the “risk-on” mood, generally negative for the yen and supportive for USD.
5️⃣ Current market snapshot —
DXY: ~98.133 (slightly lower)
USD/JPY: ~147.35 (sideways bias)
Other majors like GBP/USD and NZD/USD also firmed on global risk sentiment and GDP prints.
Implication for Technical Bias
If you’re holding a long-term bullish position from the 128 region and price is now testing the 138 support area:
Fed rate-cut expectations could cause short-term USD/JPY pullbacks.
Weak US jobs data and renewed political risks might cap USD upside.
If 138 holds, watch for price action confirmation to add to long positions.
Macro Relationship Recap:
Risk-on (equities up) → Yen weakens → USD/JPY tends to rise.
Risk-off (equities down) → Yen strengthens → USD/JPY tends to fall.

USDJPY DIAMOND PATTERN || BreakingGood opportunity in USDJPY diamond pattern on 4H
Long term target t1 149 t2 149.5 t3 150
Early entry will reward more

USD/JPY - A BUY IDEABased on recent short-term technical analysis, a "buy" outlook for USD/JPY on the 15-minute timeframe is often contingent on a few key factors. The 15-minute chart is a fast-paced environment, ideal for scalping

USD/JPY Targeting 148.890 – Bullish Momentum in PlayUSD/JPY is continuing its upward move with strong bullish momentum. After holding key support levels, the pair is now heading toward the short-term target at 148.890. Price action remains bullish, supported by Dollar strength and technical structure.
If momentum sustains, a clean break above 148.890 could lead to further upside toward 149.26 and possibly 150+ levels.
Key Levels:
🎯 Immediate Target: 148.890
🔼 Next Resistance: 149.264 / 150.500
🔻 Support: 147.850 / 147.000
📌 Bias: Bullish above 147.85
📈 Watch for a strong candle close near 148.890 for confirmation of breakout continuation.
#USDJPY #ForexTrading #TechnicalAnalysis #PriceAction #DollarYen #TrueDirections1

USD/JPY – Strong bearish weekly candle. Are longs still in play?Hello traders , here is the full multi time frame analysis for this pair, let me know in the comment section below if you have any questions , the entry will be taken only if all rules of the strategies will be satisfied. wait for more price action to develop before taking any position. I suggest you keep this pair on your watchlist and see if the rules of your strategy are satisfied.
🧠💡 Share your unique analysis, thoughts, and ideas in the comments section below. I'm excited to hear your perspective on this pair .
💭🔍 Don't hesitate to comment if you have any questions or queries regarding this analysis.

USD/JPY Drops as Dollar Weakens on Negative Jobless Claims Datahe USD/JPY pair is seeing a pullback as the U.S. Dollar tumbles following worse-than-expected jobless claims data. This data hit investor confidence, leading to a short-term downside move in the pair.
Currently, the pair is testing crucial support at 147.855. A break below this level could accelerate the downside toward the next liquidity zones, while holding above it may invite short-covering or fresh buying interest.
Technical Outlook:
📉 Dollar weakness dragging USD/JPY lower
🔻 Key support: 147.855
📈 Resistance: 149.26 / 150.50
⚠️ Volatility expected around economic releases
📌 Bias: Cautious – Watch price action near 147.855 for next directional clue.
#USDJPY #DollarIndex #ForexNews #JoblessClaims #TechnicalAnalysis #PriceAction #TrueDirections1

USD/JPY Nearing First Target USD/JPY is moving strongly to the upside, riding the wave of Dollar strength and bullish momentum. The pair is now approaching its first key target at 149.264 (weekly high). A clean candle close above this level could trigger an extended move toward 150.500 and possibly higher.
The structure remains bullish, with higher highs and strong follow-through. On the downside, equal lows at 145.935 continue to act as a key reference for long-term trend protection.
Key Levels:
✅ First Target: 149.264 (nearly achieved)
🔜 Next Upside Targets: 150.500 → 151.80
🔻 Equal Low Support: 145.935
🟩 Bias: Bullish above 148.70
📌 Watch for breakout and retest of 149.264 for confirmation of next leg higher.

USD/JPY Gains With Strengthening Dollar – Bullish Bias IntactThe USD/JPY pair is gaining momentum as the U.S. Dollar strengthens across the board. Supported by rising U.S. yields and continued divergence in monetary policy between the Fed and BoJ, the pair remains firmly in a bullish structure.
Price is pushing toward key resistance levels, with potential upside continuation if the momentum sustains. As long as the pair holds above recent support zones, buyers remain in control.
Key Technical Outlook:
Dollar strength fueling the rally
Bullish structure with higher highs/lows
Next upside levels: 149.26 → 150.50 → 151.80
Support: 147.80 / 146.50
📌 Bias: Bullish – Favoring long positions on dips
📈 Watch for breakout above 149.26 for further momentum
USDJPY - ALL TP HIT = Book ProfitsOn Friday, shared idea USDJPY, Now All TP Hit , Liquidity Taken and After than BOS on lower time Frame , Entry on Retest and TP Smashed

USD/JPY Moving Up Like a Charm – Eyes on 149.264 and BeyondSD/JPY continues its smooth upward momentum, showing strong bullish strength. The pair is now approaching the weekly high at 149.264, and if we get a decisive candle close above this level, a further rally toward 150.500 and above becomes highly probable.
On the downside, an equal low has formed at 145.935, which could act as a significant liquidity pool or potential reversal point if the trend shifts.
Key Technical Highlights:
Strong bullish momentum intact
Watching weekly high: 149.264
Break and close above may target: 150.500+
Equal low support: 145.935
Bullish structure supported by higher highs and consistent buying
📌 Bias: Bullish above 149.264
📉 Caution: If price rejects 149.26, watch for pullbacks to rejoin trend
#USDJPY #ForexAnalysis #PriceAction #BullishTrend #JPY #Dollar #TechnicalAnalysis

Option Trading💼 Option Trading 📉📈
Leverage. Flexibility. Strategic Advantage.
Option Trading is a powerful segment of the financial markets where traders and investors use derivative contracts—known as options—to speculate, hedge, or generate income. Unlike traditional stock trading, options give you the right (but not the obligation) to buy or sell an asset at a predetermined price, within a specific time frame.
It’s a strategic tool used by everyone from retail traders to hedge funds to gain exposure with limited risk and amplified potential.
🔍 Key Concepts:
✅ Call Option – Gives the right to buy an asset at a fixed price (strike)
✅ Put Option – Gives the right to sell an asset at a fixed price
✅ Premium – The price paid to buy the option contract
✅ Strike Price – The level at which the option can be exercised
✅ Expiry Date – The date on which the contract expires
✅ In-the-Money / Out-of-the-Money – Describes the moneyness of a position relative to current price
⚙️ Why Trade Options?
🔹 Leverage – Control larger positions with smaller capital
🔹 Flexibility – Bullish, bearish, neutral—there’s a strategy for every view
🔹 Defined Risk – Max risk = premium paid (in buying options)
🔹 Income Generation – Sell options (covered calls, credit spreads) for passive income
🔹 Hedging – Protect existing stock positions from volatility or loss
Option trading isn’t gambling—it’s a game of precision, risk management, and market insight. To succeed, you need to master:

Learn Advanced Institutional Trading🎓 Learn Advanced Institutional Trading
Advanced Institutional Trading is the high-level skill of trading financial markets the way professional institutions do — using big data, smart tools, and strategic decision-making to consistently win in the market. 💼📊
Learning this means going beyond basic charts or trendlines. It’s about understanding how big money moves, and how to:
🧠 Read institutional order flow
📉 Trade with algorithms and dark pools
📈 Use volume, liquidity zones & smart money indicators
🛡️ Apply institutional-level risk management
⚙️ Trade options, futures, and other derivatives at scale
💬 Interpret economic data like banks and funds do
You’ll learn to:
Identify entry and exit points based on institutional footprints
Use macro and micro market analysis
Build a trading system with logic and consistency
React to live news, earnings, and global events the way hedge funds do
📌 In simple words:
Learning Advanced Institutional Trading gives you the mindset, tools, and strategies used by the top 1% of traders — so you can trade smart, calculated, and professional just like the big players.

USDJPY - 4HR BUY SETUP🟡 USD/JPY – Smart Money Setup Around 4H Order Block
Pair: USD/JPY
Trade Bias: Long
Position Type: Small Quantity (Not A+ Setup)
Setup Basis: 4H OB + Liquidity Sweep + CISD Pattern
---
🔍 Market Breakdown:
Price is currently reacting inside a 4H Bullish Order Block.
A clear liquidity sweep has occurred just before the reaction, hinting at potential Smart Money activity.
A CISD (Complex Internal Structure Displacement) pattern is developing, often a precursor to market direction shifts.
---
✅ Trade Plan:
Long Entry only after SMC confirmation above: 147.250
Execution: Look to enter on the retest after the break of 147.250 (only if confirmation is strong).
Stop-Loss: Placed at 145.700 to stay below structure and liquidity traps.
Target Zone: To be updated based on price delivery post-confirmation.
⚠️ This is not a premium-grade setup, so position sizing remains reduced to manage risk properly.
---
📌 Important Notes:
This trade idea is shared for educational and analytical purposes.
Always trade based on your own plan, and follow strict risk management.
---
📣 Like clean breakdowns rooted in Smart Money Concepts?
✅ Follow for more:
Institutional-style entries
OB + Liquidity + Structure combos
High RR setups with precise SL logic
#USDJPY #SmartMoney #Forex #OrderBlock #LiquiditySweep #CISD #PriceAction #SMC #TradingView #FXSetups

Institution Option Trading🏢 Who Are These Institutions?
Institutions involved in option trading include:
🏦 Hedge Funds
🏢 Proprietary (Prop) Trading Firms
💼 Investment Banks
🌍 FIIs/DIIs
🧠 Pension Funds & Insurance Companies
They trade options across equities, indices (like Nifty/Bank Nifty), commodities, and currencies, often managing portfolios worth hundreds of crores.
🔍 Institutional Option Trading Strategies
1. Delta Neutral Strategy (Market-Neutral)
Example: Sell ATM straddle and hedge with futures.
Objective: Profit from time decay (theta) while keeping position neutral to price movement.
2. Volatility Arbitrage
Institutions bet on difference between implied and actual volatility.
Buy options when IV is low, sell when IV is high.
3. Calendar Spreads
Sell near expiry option, buy longer expiry of the same strike.
Used when institutions expect IV to rise but minimal short-term price movement.
4. Iron Condors and Butterflies
Multi-leg strategies for range-bound markets.
Used with large capital to generate steady income with limited risk.
5. Protective Puts / Covered Calls
Portfolio hedging: buy puts to protect against downturns, sell calls to earn extra income.
Very common among mutual funds and long-term portfolios.
📈 Option Chain Reading – Institutional Footprint
When institutions enter or adjust option positions, they leave footprints in the option chain. You can spot them by watching:
Sudden spike in OI (Open Interest) at specific strikes
Sharp rise in IV without much price movement
Heavy Put or Call writing near resistance/support zones
Unusual option activity (UOA) before key events
⚠️ How Retail Traders Can Learn From Institutional Option Trading
Track Option Chain + OI Changes Daily
Learn to Read Greeks Before Taking a Trade
Watch How IV Shifts Before & After Events
Backtest Simple Institutional Strategies (e.g. ATM Straddles)
Focus on Consistency and Capital Protection
🛑 Common Retail Mistakes in Options (Avoided by Institutions)
Buying deep OTM options blindly
Overtrading in low-volume strikes
Selling naked options without hedge
Ignoring IV or theta decay
Trading without stop-loss or adjustment plans
🧘 Conclusion: Why Mastering Institutional Option Trading Matters
Understanding how institutions trade options allows you to:
✅ Avoid emotional traps
✅ Trade with the flow of smart money
✅ Use real risk management
✅ Build income and protection strategies
✅ Improve win-rate and longevity in trading

USDJPY Likely to Move Higher – Support & Resistance AnalysisUSDJPY is showing strong bullish momentum and is expected to move higher in the coming sessions.
