Define Option Chain✅ Definition of Option Chain (Explained Simply)
An Option Chain is a table or list that shows all available option contracts (Calls and Puts) for a particular stock or index — along with key data like strike prices, premiums, open interest, and more.
It helps option traders quickly analyze where the market expects the stock or index to move, reverse, or stay range-bound.
📘 In Simple Terms:
An option chain is like a scoreboard of what traders are betting on — whether prices will go up or down, and at what level.
🧩 What Does an Option Chain Show?
An option chain is divided into two parts:
Call Options (CE) 🔵Strike Price Put Options (PE) 🔴
Each row in the option chain represents:
A specific strike price
Its call and put premiums
Open interest (OI) — number of contracts open
Change in OI — fresh buying/selling activity
Volume — how many contracts traded
Implied Volatility (IV) — market’s expected volatility
🧠 Key Terms in Option Chain (Explained Simply)
Term Meaning in Easy Words
Strike Price The price at which you can buy/sell the underlying asset
Call Option (CE) Bets the price will go up
Put Option (PE) Bets the price will go down
Premium The price you pay for buying 1 option
Open Interest (OI) How many contracts are currently open
Change in OI How many contracts were added or closed today
Volume Number of contracts traded today
IV (Implied Volatility) Market’s prediction of future price fluctuation
📊 What You Can Learn From It:
Where traders expect support (high Put OI zones)
Where traders expect resistance (high Call OI zones)
Which strikes are seeing new buying/selling activity
Possible expiry range (Max Pain level)
📍 Example (Bank Nifty Option Chain Sample):
CE (Call Options) Strike PE (Put Options)
OI: 5.2 lakh 49,000 OI: 6.1 lakh
OI: 8.4 lakh 🟩 49,500 OI: 10.3 lakh 🟥
OI: 12.1 lakh ✅ 50,000 OI: 9.5 lakh
✅ Highest Call OI = 50,000 → Resistance
✅ Highest Put OI = 49,500 → Support
➡️ So, market may stay between 49,500 and 50,000 for now
🧠 Why Option Chain Matters for Traders:
Helps spot support/resistance without charts
Identifies where big institutions are writing options
Assists in building option strategies (like Iron Condor, Straddles)
Key for expiry day (Thursday) trades
✅ Summary:
Option Chain Is... Option Chain Helps You...
A table of all calls & puts Find support & resistance from OI levels
Loaded with strike-wise data See where traders are buying/selling most
Used in options trading Predict expiry range & big player activity
USDJPYTMSP trade ideas

USD/JPY) LOGN TIME Analysis Read The captionSMC trading point update
Technical analysis of USD/JPY on the daily timeframe, highlighting a long-term downtrend reversal with potential for significant upside.
---
Analysis Summary
Pair: USD/JPY
Timeframe: Daily
Current Price: 147.442
Bias: Bullish breakout from a descending wedge structure.
---
Key Technical Insights
1. Descending Trendline Break:
Price has broken above the long-term downtrend line, signaling a reversal.
Breakout area is circled in yellow, confirming bullish intent.
2. Trendline & Structure Support:
Multiple rejections from the ascending support trendline (marked by green arrows) confirm accumulation and higher lows.
3. 200 EMA as Dynamic Resistance/Support:
Price is now above the 200 EMA (147.920) — a bullish signal, turning resistance into support.
4. RSI (14):
RSI at 62.99, approaching overbought territory, but still has room to push further.
---
Target Point
Target: 158.951
Based on measured move from wedge breakout and historical resistance level.
---
Trade Setup Idea
Direction Entry Stop-Loss Target
Buy 147.40–147.60 Below 145.80 158.95
Mr SMC Trading point
---
Summary
This chart signals a major bullish breakout on USD/JPY, with the break of a year-long downtrend structure, reclaiming the 200 EMA. If this breakout sustains, price could aim for 158.95 in the coming weeks.
Please support boost 🚀 this analysis)

USDJPY – Is the Downtrend Taking Shape?On the H4 chart, USDJPY shows signs of weakening as it repeatedly fails to break above the long-term descending trendline. Despite a recent recovery toward the 147.000 level, buying momentum appears to be fading. The price structure suggests the possibility of a false breakout before a reversal toward the 144.300 support zone—an area with multiple unfilled FVGs.
From a news perspective, traders are awaiting today’s upcoming U.S. CPI report. If inflation data comes in hotter than expected, the USD may gain short-term strength. However, a weaker CPI reading could trigger a quick reversal in USDJPY, confirming the bearish setup. The 147.000 level remains the critical zone to watch for any potential rejection or breakout.

USDJPY: Weak Rebound, High Downside RiskUSDJPY remains under bearish pressure as price continues to be rejected at the descending trendline resistance. The 145.000–145.100 zone acts as a strong resistance area where price has repeatedly reversed.
The recent upward move appears to be a weak pullback, lacking the momentum to break the previous bearish structure. If price continues to be rejected at this zone, a likely correction towards the 142.100 support area is expected.

USD.JPY Strong sell all time frameas analyzed before.
USD.JPY has given strong sell signal on all time frames.
the indicator is in sync all time frame sell and now price has fallen through the trendline. signaling a strong downtrend of USD.JPY
we continue to look for sell signal when price recovers at time M15+h1

USDJPY Trade Recommendation – Second SELL Entry (15-Min Chart)🔻 Strategy: Continue selling with the short-term downtrend, entering on technical pullback
🎯 Trade Setup:
Sell Entry Zone: 143.94 – 144.00
Stop Loss (SL): 144.45 (just above SMA89 and minor resistance zone)
Take Profit (TP): 143.28 – 143.36
Risk:Reward Ratio: Approx. 1:2.5 to 1:3
📊 Technical Analysis:
1. Trend Direction:
The market is clearly in a short-term downtrend on the 15-minute timeframe.
Price has been forming lower highs and lower lows, indicating strong bearish pressure.
2. Dynamic Resistance – SMA89:
SMA89 (red line) is acting as dynamic resistance, consistently rejecting price.
The entry zone aligns with previous minor resistance and the down-sloping SMA, making it ideal for re-entry short positions.
3. Target Zone – Technical Support:
TP zone (143.28 – 143.36) is a recent swing low/support level, likely to be revisited if bearish momentum continues.
=> Fl and tradding with me!

USD/JPY pair gives full time sell signal.Looking at the D1 chart, we can see one thing, USD/JPY has given a strong bearish signal, a bet expecting the price to decrease by 1,000 pips with time D1.
On h1, there is a clear bearish signal, you can also find a suitable signal on M15 for this USD/JPY bet

USD JPY Weekly Free Analysis (28-06-25 to 05-07-25)USD JPY
USD/JPY is showing signs of a potential rebound from the 144.00–143.50 zone as the U.S. dollar remains strong heading into key economic data next week. The Federal Reserve’s hawkish stance, with no immediate signs of rate cuts, continues to support USD demand.
Meanwhile, the Bank of Japan remains ultra-dovish, keeping interest rates near zero or negative, and showing little urgency to tighten policy. This divergence in monetary policy keeps pressure on the yen, especially as Japanese inflation is still under control and economic growth is moderate.
Technically, the pair may dip slightly before bouncing back up toward 145.50+, as suggested by the V-shaped recovery pattern forming.
Key Points:
Fed staying hawkish, supports USD
BoJ remains dovish, weak JPY outlook
Technical support around 143.50–144.00
Upcoming US data (NFP & ISM) could boost USD

USD/JPY Bullish Reversal AnalysisUSD/JPY Bullish Reversal Analysis 📈💹
🔍 Technical Overview:
The chart illustrates a strong bullish reversal pattern forming on USD/JPY after price reacted from a key support zone at 144.600. This level has held firm multiple times, marked by green arrows, signaling strong buying interest.
📐 Chart Patterns & Structure:
✅ A bullish harmonic pattern (possibly a bullish Bat or Gartley) is completing near the 144.600 zone.
🔄 Multiple rejection wicks and bullish engulfing patterns indicate a potential upside reversal.
🔵 Descending trendlines have been broken, confirming momentum shift.
🔁 Previous resistance turned support (near 145.000) is acting as a possible launchpad for the next move.
🎯 Upside Target:
The projected move targets the resistance zone at 147.698, aligning with previous highs and a significant supply area.
If price breaks above 145.900 convincingly, continuation toward this resistance is expected.
🔻 Downside Risk:
A break below 144.600 would invalidate the bullish setup and expose price to the lower support range near 142.000–143.000.
📊 Conclusion:
USD/JPY is showing signs of bullish reversal from a strong demand zone. If price sustains above 145.000 and breaks the minor consolidation, the pair could rally toward 147.698 🎯.
Bias: Bullish ✅
Support: 144.600
Resistance: 147.698

USD/JPY Bullish Reversal Trade Setup – Key Support Test at 145.2Entry Point: 145.273 (highlighted in blue)
Stop Loss: ~144.817–145.260 (purple zone)
Target Point (TP): 148.133 (upper resistance zone)
📉 Recent Price Action:
Price peaked near 148.05 before reversing sharply and breaking the trendline.
The market is currently testing the support zone (near the 145.273 entry level).
Moving averages (red = short-term, blue = long-term) show a crossover to the downside, suggesting short-term bearish momentum.
📈 Trade Setup:
Strategy Type: Long (Buy) Setup
Risk/Reward: Favorable, approximately 1:2+
Entry Zone: The current price is close to the entry level at 145.273, making this a timely area to watch for a bounce or confirmation.
⚠️ Risk Factors:
If price breaks below 144.817, the setup becomes invalid.
Short-term momentum is still bearish; confirmation (like a bullish engulfing candle or support hold) is important before entering.
✅ Confirmation Triggers for Entry:
Strong bullish candlestick pattern near entry zone.
RSI or MACD bullish divergence (not shown but useful to check).
Volume spike on bounce from support.

USDJPY LongPrice is in a uptrend. Price created an orderblock on the 30min timeframe. price then retested the orderblock and is rejecting the orderblock. Take profit is at 147.980 and the stoploss is at 147.150. It is a 1:2 RR trade.

TRIPLE BOTTOM USD/JPY The Triple Bottom is a bullish reversal pattern that signals a potential shift from a downtrend to an uptrend. It’s like the market saying, “I’ve tested this support level three times, and I’m done going lower.”
Here’s how it plays out:
- Three Equal Lows: Price hits a support level three times, forming three distinct troughs at roughly the same level.
- Resistance Line (Neckline): The highs between the lows form a horizontal resistance. A breakout above this confirms the pattern.
- Volume Clue: Volume often decreases during the formation and spikes on the breakout—showing bulls are stepping in.
Trading Strategy:
- Entry: After a confirmed breakout above the neckline.
- Stop-Loss: Just below the third bottom.
- Target: Measure the distance from the bottoms to the neckline and project it upward from the breakout point.

USD/JPY 4H Chart Analysis – Bullish Breakout Ahead?📈 USD/JPY 4H Chart Analysis – Bullish Breakout Ahead? 🚀💹
The USD/JPY pair is currently approaching a critical resistance zone (145.800 - 146.000), which has acted as a strong supply area in the past. The price has shown bullish momentum as it builds higher lows and heads toward this resistance.
🔍 Key Observations:
🔵 Resistance Zone: Clearly marked and tested multiple times. A breakout above this level could trigger a bullish continuation.
📊 Bullish Structure: The pair is forming a strong uptrend with higher highs and higher lows on the 4H timeframe.
🔄 Retest Scenario: Chart suggests a potential breakout above the resistance, followed by a bullish retest before continuing toward the target zone at ~148.900.
🟢 Upside Target: 148.900 (Previous swing high) – a potential gain of over 300 pips from breakout point.
📌 Trading Outlook:
✅ A confirmed breakout and retest of the resistance zone could offer a high-probability long setup.
❌ A failure to break and hold above the resistance may result in short-term consolidation or reversal.
📅 Watch Levels:
Resistance: 145.800 – 146.000
Support (breakout retest): 145.200 – 145.500
Bullish Target: 148.900
📢 Conclusion: Bulls are in control as long as price sustains above the resistance zone. A clean breakout followed by a retest could offer an attractive buying opportunity with a well-defined risk-to-reward setup. 🔥📊

Slow movements in forexUSDJPY is bullish or bearish or sideways.
Whatever it is, focus on your strategy and size.
Everyday progress is process of becoming big, not profits.
#usdjpy #usd #gold #xauusd #forex

USDJPY – Momentum Fades Near 146 BarrierUSDJPY is approaching the significant resistance level at 146.020 following a parabolic rebound. This area previously triggered a sharp sell-off, and a minor double top pattern may be forming. If price gets rejected here, the support zone around 144.470 (EMA89 + demand zone) becomes a likely target for a pullback.
The recent upside was supported by hawkish comments from BoJ Governor Ueda, but the main market focus remains on the U.S.–China trade talks. If tensions ease, the USD could weaken, supporting the bearish scenario for USDJPY.

USDJPY – Buying momentum builds, uptrend in sightUSDJPY has just bounced strongly from the key support zone around 142.510 – a level that has acted as a “fortress” over the past two weeks. Price action is gradually regaining momentum, forming a potential double bottom and heading toward a retest of the long-term descending trendline.
Currently, the 144.800–145.000 area is the nearest resistance, aligning with both the EMA and the descending trendline. If buyers maintain control, a breakout above this zone could pave the way for the next leg up toward 145.750 and beyond.
In terms of news, the latest U.S. ISM Services data came in weaker than expected, reducing rate hike expectations. While this puts mild pressure on the USD, the reaction from USDJPY suggests the market is leaning toward a rebound rather than a breakdown.

USDJPY – Downtrend Continues, 143.500 Is the Key ZoneUSDJPY is moving within a clear descending channel and is now approaching the strong resistance area at 143.500 – where the EMA 34, EMA 89, and the upper trendline all converge.
Historically, each time price touched this zone, a strong rejection followed. If the same happens again, we could see a move back down to 142.000 and potentially 140.500.
On the fundamental side, the recently released U.S. ISM Services data disappointed, fueling expectations that the Fed might cut rates sooner – adding bearish pressure to the USD.
Preferred scenario: watch for price reaction around 143.500 to enter a short position in line with the downtrend.

usdjpyPrice action trading is a methodology in financial markets where traders make decisions based on the actual price movements of an asset over time, rather than relying heavily on technical indicators or fundamental analysis. It involves observing and interpreting patterns and trends in price charts to predict future price movements.

FXHUNTER / USDJPYHello, I am FXHUNTER. Welcome to my channel. Analysis of the USDJPY symbol. As you can see, the price has hit an important area and returned, and a choch has formed. On the resulting order block, another order block has been formed, which has the possibility of supporting the price. If the price returns to the specified area, you can enter a buy trade by forming a choch in the 1-minute time frame.

USDJPY – Rebounding from Support after Positive PMI DataIn the latest session, USDJPY is gradually regaining its upward momentum after the US released a better-than-expected manufacturing PMI. The data suggests that the US industrial sector remains strong, reducing pressure on the Fed to ease policy. As a result, the US dollar benefited, lifting USDJPY off its recent technical bottom.
On the H4 chart, the pair is trading within a sideways range between 142.200 and 144.800. Each time it approaches the 142.200 level, buying pressure returns, forming a solid support zone. Although EMA 34 and EMA 89 are slightly sloping downward, the signals are not strong enough to break the current accumulation structure.
Expected scenario: if the price continues to hold above the 142.200 support zone and forms a solid accumulation pattern, USDJPY is likely to bounce toward the 144.800 area – which may act as the next short-term resistance. On the contrary, if the support breaks, the structure could shift into a more bearish outlook.

Buy viewCan we get this move its a 1:16rr trade
Waiting for it to execute for it.
Let's hope for the best
Trade as per your risk management.
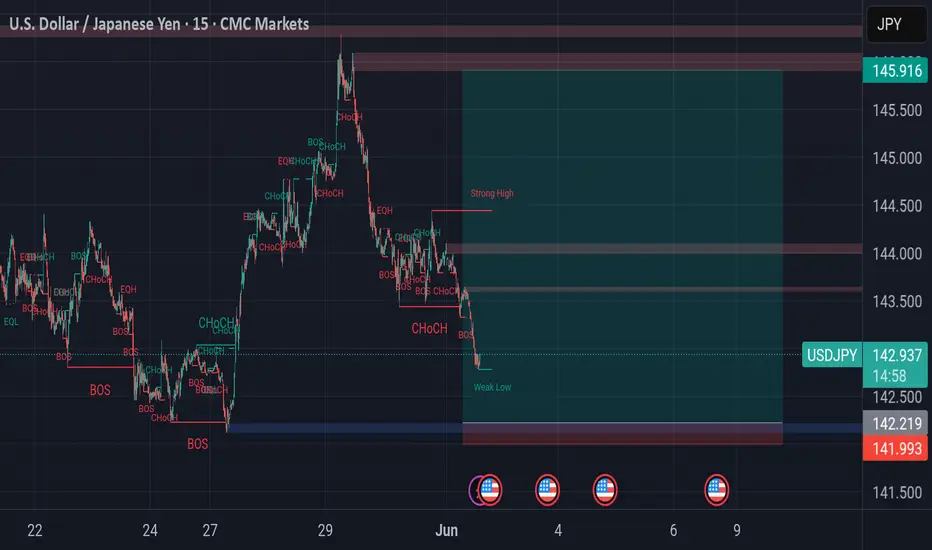
USDJPY Bearish Continuation SetupTrend Analysis
The market is in a clear downtrend, evidenced by the sequence of lower highs and lower lows.
The descending trendline has been respected multiple times, acting as dynamic resistance.
🧠 Key Technical Factors
Rejection Zone (Supply Area):
The marked “Rejection Point” aligns with the confluence of the trendline resistance, 50 EMA (red), and historical supply.
Price attempted to break above but faced a strong rejection—signaling institutional sell interest.
EMA Confluence:
50 EMA (142.993) and 200 EMA (144.063) are both sloping downward.
Price is trading below both EMAs, confirming bearish momentum and trend continuation bias.
BOS (Break of Structure):
Multiple BOS levels marked, showing a consistent pattern of structure breaks to the downside.
Each rally is met with selling pressure, failing to create new highs.
🧩 Projected Price Action
Current retracement could retest the trendline/50 EMA before a potential continuation move downward.
Expectation is a lower high formation near the descending trendline followed by a bearish impulse.
🏹 Bias: Bearish
Traders might consider short opportunities around the 142.90–143.00 zone, targeting 142.00 and below, with stops just above the trendline/supply zone.
⚠️ Risk Note
A clean break and close above the trendline and 50 EMA would invalidate this setup and could lead to a shift in structure.

USD JPY Weekly Free Analysis (25-05-25 to 31-05-25)USD/JPY Outlook: The pair is consolidating near 142.50 (-0.03%) after testing 142.68. Key resistance at 143.00, support at 142.00. A break above 142.68 could target 143.00+, while a drop below 142.00 may test 141.40. Watch BoJ intervention risks and US yields for direction. (Free analysis—confirm with news/volume).
