USD JPY Weekly Free Analysis (25-05-25 to 31-05-25)USD/JPY Outlook: The pair is consolidating near 142.50 (-0.03%) after testing 142.68. Key resistance at 143.00, support at 142.00. A break above 142.68 could target 143.00+, while a drop below 142.00 may test 141.40. Watch BoJ intervention risks and US yields for direction. (Free analysis—confirm with news/volume).
USDJPYTMSP trade ideas

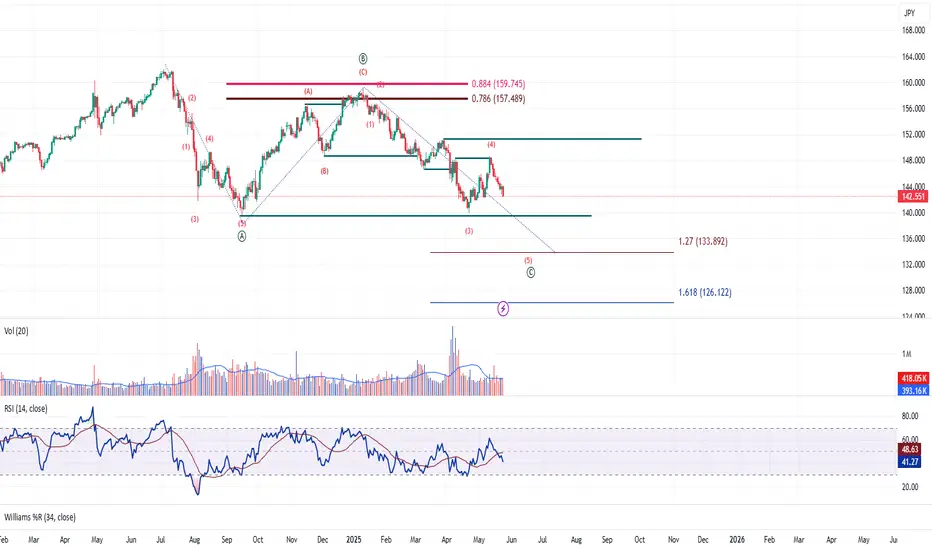
USDJYP positional view.USDJPY day chart seems in ABC bearish pattern. Now its trade in C wave sub wave of 5.
down side target 1.27 @ 133.89 and 1.618 @ 126.12.
USDJPY MULTI TIME FRAME ANALYSISHello traders , here is the full multi time frame analysis for this pair, let me know in the comment section below if you have any questions , the entry will be taken only if all rules of the strategies will be satisfied. wait for more price action to develop before taking any position. I suggest you keep this pair on your watchlist and see if the rules of your strategy are satisfied.
🧠💡 Share your unique analysis, thoughts, and ideas in the comments section below. I'm excited to hear your perspective on this pair .
💭🔍 Don't hesitate to comment if you have any questions or queries regarding this analysis.
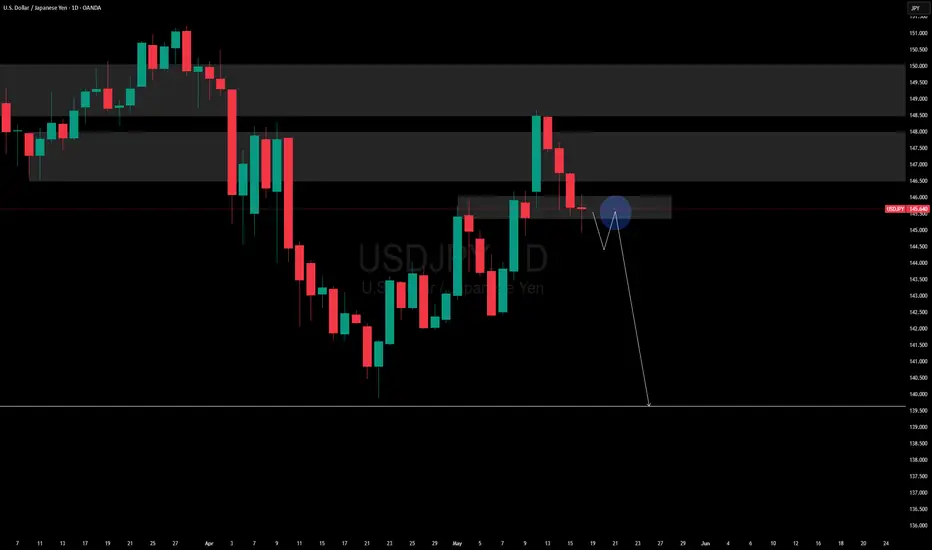
KEY SUPPORT IN FOCUS - CAN USDJPY HOLD THE LINE?Symbol - USDJPY
USDJPY is approaching a critical support level amid a prevailing local downtrend. Downward pressure on the US dollar continues to intensify, reinforcing the bearish momentum in the pair.
The US dollar index has begun to decline, which is mirrored in the weakening of USDJPY. Selling pressure is gaining momentum, and a local downtrend is clearly forming. The pair is currently testing key support at 144.82. A confirmed break below this level would likely pave the way toward lower support zones at 143.44 and 142.35, Sustained price action below 144.82 may act as a trigger for an extended sell-off.
Key Resistance levels: 145.34, 146.07
Key Support levels: 144.82, 143.44, 142.35
Both global and local trends remain bearish. The ongoing decline in the dollar may serve as an additional resistance factor, contributing to further downward momentum. A break and consolidation below the 144.82 support level would likely confirm the continuation of the bearish trend.
USD/JPY Long Trade Setup – Key Support Rebound Targeting 148.674Entry Point:
Price: 143.373
The chart suggests initiating a long (buy) position at this level, which is just slightly below the current market price.
Stop Loss:
Price: 141.707
Positioned below a strong support zone. This level protects the trade from excessive downside risk if the price breaks down.
Target Point:
Price: 148.674
The target is clearly defined, indicating a potential gain of approximately 5.991 points, or 4.20% from the entry.
🟪 Support/Resistance Zones
The purple boxes indicate demand (support) and supply (resistance) zones.
The lower zone (entry/stop area) shows a historically significant support range that has been tested multiple times (indicated with orange circles).
The upper purple zone marks the take-profit area, which coincides with previous resistance.
📊 Moving Averages
Blue Line: 200 EMA (Exponential Moving Average) – acting as dynamic resistance.
Red Line: 50 EMA – price is currently trading below it, indicating bearish short-term pressure but potential for reversal.
🧠 Trade Idea Summary
Bias: Bullish (long position)
Risk-Reward Ratio: Favorable
Risk: ~1.67 points (from 143.373 to 141.707)
Reward: ~5.3 points (from 143.373 to 148.674)
Approx. R:R = 1:3.17
Validation: The setup relies on the price holding the key support zone and bouncing higher, targeting the next major resistance.
⚠️ Considerations
Monitor for bullish candlestick patterns near the entry zone.
Keep an eye on macroeconomic news (like BoJ or Fed updates) that could cause volatility in USD/JPY.
Confirm momentum shift with RSI or MACD if using indicators.

USDJPY - May 3rd WeekAll time frames are uptrend.
4H - downtrend direction which is pullback.
It is at 0.618.
So wait for 4H bullish candle pattern to go for buy.
If it breaks the support, do not go for sell.
wait till it breaks 144.000 to become seller

USDJPY MULTI TIME FRAME ANALYSISHello traders , here is the full multi time frame analysis for this pair, let me know in the comment section below if you have any questions , the entry will be taken only if all rules of the strategies will be satisfied. wait for more price action to develop before taking any position. I suggest you keep this pair on your watchlist and see if the rules of your strategy are satisfied.
🧠💡 Share your unique analysis, thoughts, and ideas in the comments section below. I'm excited to hear your perspective on this pair .
💭🔍 Don't hesitate to comment if you have any questions or queries regarding this analysis.
USD JPY Weekly analysis (18-05-25 to 24-05-25)📊 USD/JPY Technical Analysis (4H Chart)
As of: May 18, 2025
Current Price: ~145.63
🔍 Key Technical Setup:
Price has pulled back after rejecting the descending trendline.
A lower high may form near 146.00–146.40, followed by a potential drop toward 144.00 and lower.
Structure suggests a fake breakout setup → bearish continuation likely.
🟢 Trading Plan:
Sell on pullback near 146.00–146.40 with SL above 146.60
Targets: 144.30 (TP1), 143.70 (TP2), possibly 142.50 if momentum builds
🌍 Fundamental Outlook: Upcoming Week (📅 20–24 May 2025)
🇯🇵 Key JPY Drivers:
BoJ Watch: If USD/JPY approaches 147.00+, risk of BoJ intervention chatter increases
May 20 (Mon): Japan GDP Annualized QoQ (Q1) → Watch for growth surprises
JPY could strengthen if GDP data beats expectations or if global risk-off flows increase.
🇺🇸 Key USD Drivers:
May 23 (Thu): U.S. S&P Global PMIs (Manufacturing & Services)
• Weak PMIs = pressure on yields = USD weakness
• Strong PMIs = support for USD, possibly short-term bullish
Fed Speakers: Multiple Fed members on schedule – any dovish tone could spark a USD sell-off
📌 Strategy for the Week:
Sell on rallies near 146.00–146.40 as long as the trendline holds.
Watch Japan GDP and U.S. PMIs for direction confirmation.

USD/JPY Rebounds from Key Support – Eyes on 150.035 Target Support Zone:
The price is currently respecting a strong support area between 144.459 - 145.101. This zone aligns closely with the 200 EMA (145.101), increasing its validity.
EMAs:
50 EMA (146.059) is slightly above the current price.
200 EMA (145.101) is acting as dynamic support.
Price is currently trading just above the 200 EMA and below the 50 EMA — a neutral-to-bullish bias, especially since it bounced off support.
Bullish Signal:
The price has rejected the support zone and is attempting to break higher, supported by the bullish arrow projection.
Target Point:
Clearly marked at 150.035, which is a previous resistance level. This gives a potential upside of around 460 pips from the support area.
🧭 Trade Idea (if bullish bias is maintained)
Entry: Around 145.40–145.10 (current area)
Stop Loss: Below 144.459 (support base)
Take Profit: Around 150.035
Risk-Reward: ~1:3 or higher, depending on exact entry/exit.
⚠️ Caution
Watch for resistance at 146.059 (50 EMA); a clean break and retest would further confirm upside potential.
If price closes below 144.459, bullish invalidation could lead to a deeper correction

Buy Trade - USD/JPYGreetings to everyone!
Place a buy trade on USD/JPY and check out my chart for the ideal entry, stop-loss & target placement.
Remember :-
* Move your SL to breakeven once the trade reaches 1:1.4 R.
* Aim for a minimum reward of 1:1.5 R.
* Don't risk more than 3% of your total margin.
Let's execute this trade smartly! 🚀
💬 About Me:
I am a professional trader with over four years of experience in the markets. I focus on swing trading using the 4H timeframe, mainly in the forex space. The trades I share here are the actual positions I’m executing. I post them as a small gesture to give back to the trading community that’s been a big part of my journey.
Cheers! 🙏

USDJPY MULTI TIME FRAME ANALYSISHello traders , here is the full multi time frame analysis for this pair, let me know in the comment section below if you have any questions , the entry will be taken only if all rules of the strategies will be satisfied. wait for more price action to develop before taking any position. I suggest you keep this pair on your watchlist and see if the rules of your strategy are satisfied.
🧠💡 Share your unique analysis, thoughts, and ideas in the comments section below. I'm excited to hear your perspective on this pair .
💭🔍 Don't hesitate to comment if you have any questions or queries regarding this analysis.

USD/JPY Bullish Setup – Demand Zone Buy Opportunity Toward 151.5🔍 Chart Overview (4H Timeframe):
Currency Pair: USD/JPY
Trend: 📈 Uptrend
EMA 70: 🔴 (144.776) – Price is trading above it = Bullish Bias
---
🟦 Demand Zone
📌 Zone: 144.804 – 146.324
💡 What it means: Strong buying interest expected here
🟢 Support line + EMA = Confluence zone!
---
✅ Entry Point:
📍 Between: 146.324 – 146.423
🎯 Best area for long (buy) position
📊 Wait for a pullback to this area before entering
---
❌ Stop Loss:
📉 Below demand zone
🔻 Range: 144.705 – 144.776
🛡️ Helps protect against unexpected drop
---
🎯 Target Point:
📈 151.500
🟩 Big reward area
🔥 Previous resistance zone = Ideal profit-taking point
---
🧭 Summary:
✅ Entry: 146.324
❌ Stop: 144.776
🎯 Target: 151.500
Risk-to-Reward: Excellent!

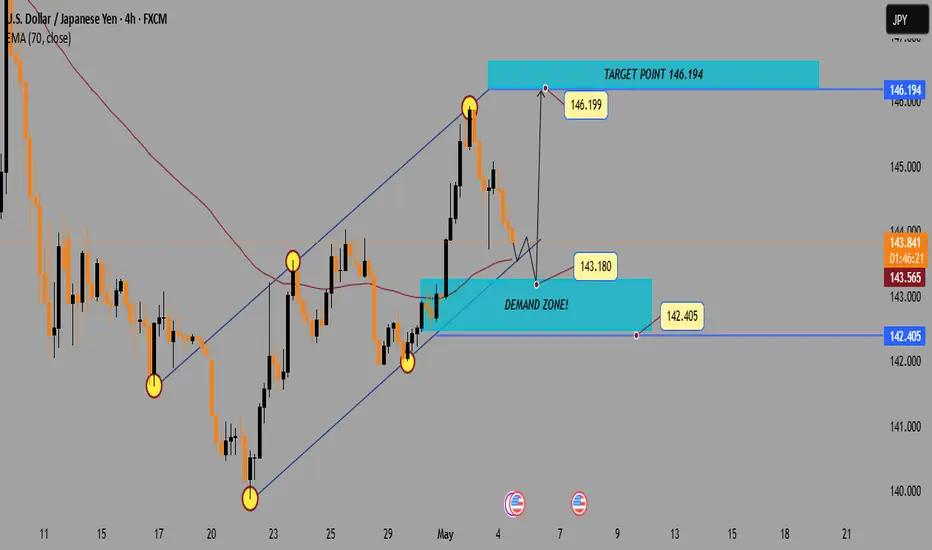
USD/JPY4H Analysis:Demand Zone ReTest Before Bullish Continuatio1. Trend Channel
🔼 Uptrend: The pair is moving inside an ascending channel.
▪️ Support: Lower boundary of the channel.
▪️ Resistance: Upper boundary of the channel.
2. Recent Price Action
🔴 Pullback: After reaching the top at 146.199, price is retracing.
📉 Price is now heading toward the Demand Zone.
3. Demand Zone
🟦 Demand Zone (142.405 – 143.180):
This zone could act as a strong support
Buyers might step in here
Watch for bullish patterns or rejections around this area
4. EMA 70
📏 EMA 70 (143.568) is slightly below current price (143.949) — this may offer temporary support/resistance.
5. Target
🎯 Target Point: 146.194
If price bounces from demand zone, this is the next bullish target.
Possible Scenario
1. 🔽 Price dips into the Demand Zone
2. 🟢 Bullish bounce → Confirm with candlestick signals
3. 🚀 Upside move targeting 146.194
USD/JPY) Bullish reversal analysis Read The ChaptianSMC Trading point update
Technical Analysis USD/JPY suggests a bullish outlook based on the following key technical components:
1. Buying Zone: The chart identifies a green rectangular area labeled "BUYING ZONE" just above the 200 EMA (blue line at 144.079). This implies that price retracement into this zone could be an opportunity to go long (buy).
2. Support & Resistance:
Support Level: Clearly marked around 143.00, showing a previous demand area.
Resistance Level: Around the 145.800–146.000 region, price previously rejected here.
3. Bullish Pattern: The curved arrow suggests the formation of a bullish continuation pattern (possibly a cup & handle or flag), with the expectation of a breakout toward the upside.
4. Target Point: The target is projected at 148.153, implying a potential move of approximately 291.7 pips from the buying zone—suggesting a favorable risk-reward ratio.
5. RSI Indicator: The RSI (Relative Strength Index) is currently around 55, not in the overbought zone, indicating more room for upside movement.
Mr SMC Trading point
Summary of Idea:
Strategy: Buy near 145.00–145.20 (Buying Zone).
Stop Loss: Just below the 200 EMA or the lower bound of the green zone.
Take Profit: Near the 148.153 target.
Confirmation: Wait for bullish confirmation/candlestick reversal in the buying zone.
Pelas support boost 🚀 analysis follow)

USD JPY Weekly analysis (10-05-25 to - 17-05-25)📈 Technical Analysis – USD/JPY (4H Chart)
Current price: 145.37
Chart Insights:
Strong bounce from local support around 144.80
Green arrow shows expected move toward 146.50, right below the descending trendline resistance
Price is inside a bullish swing, but major resistance looms
Trendline: Clear downward trendline from recent highs (~149), acting as dynamic resistance
🌐 Fundamental Drivers – USD/JPY
🇺🇸 United States
CPI data – May 15: If inflation is cooler, it weakens the USD and could halt this rally
Retail Sales – May 16: Will gauge consumer strength
Market expectations for rate cuts later in 2025 may cap upside
🇯🇵 Japan
BoJ remains ultra-dovish, but any verbal intervention (like in late 2024) could trigger sharp JPY appreciation
Yen still undervalued, but only reacts strongly with policy action or major USD moves
✅ Conclusion
The current move shows bullish momentum toward 146.50, but a break and close above the trendline is essential for further upside. U.S. CPI and Retail Sales will drive direction. A hot CPI would support USD strength, while a miss could push it back toward 144.80 or lower.

USDJPY Cup & Handle – Eyes on 147.883Entry Point: 143.525 (unchanged)
Stop Loss: 141.847 (unchanged)
Target Point One (TP1): 145.063 (unchanged)
Final Target (TP2): Now refined to 147.883 instead of 147.894 — a small, precise update.
📈 Pattern and Structure:
Cup-and-handle formation still intact, indicating a continuation pattern.
Support confirmation at the 143.5 zone, showing a potential base for a bullish reversal.
The chart shows strong upside projection toward the resistance band near 147.8–148.0, highlighted with the upper purple zone.
📊 Risk-Reward Profile:
Risk (Entry to SL): 143.525 – 141.847 = 1.678
Reward (Entry to TP2): 147.883 – 143.525 = 4.358
Reward-to-Risk Ratio: 4.358 / 1.678 ≈ 2.6R — a favorable risk/reward setup.
🧠 Trade Notes:
Entry is slightly above a demand zone.
First target is conservative, near a known resistance.
Final target aligns with prior highs and the broader ascending wedge’s upper bound.
Timing suggests the bullish push may unfold over the next few sessions (likely May 6–8 range, as curved arrow indicates a rounded retest/bounce scenario)

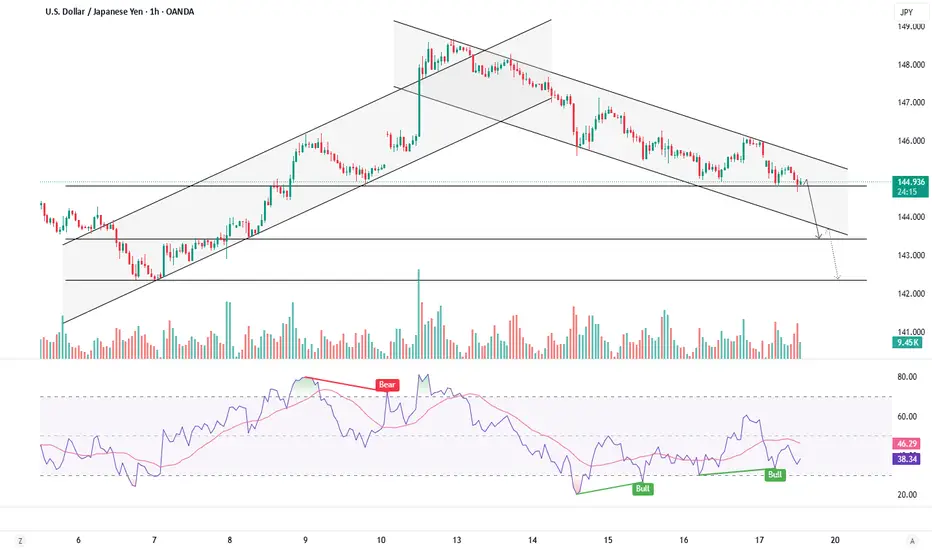
USD/JPY) bearish Technical AnalysisHELLO 👋 Dear friend USD JPY Traders
Technical Analysis represents a bearish analysis setup on the USD/JPY 1-hour timeframe, with the following key elements:
1. Ascending Channel: Price was previously moving inside an ascending channel, indicating bullish momentum.
2. CHoCH (Change of Character): A break below the channel support and structure level, marked as a change in market direction (from bullish to bearish).
3. Support Level: The price is currently testing a support zone around 142.400. The annotation suggests, "IF BREAK OUT", meaning a break below this support could trigger further downside.
4. Bearish Target: If support breaks, the projection is for the price to drop to the 139.872 zone, marked as "POINT".
5. EMA Bearish Crossover: The 50 EMA (red) has crossed below the 200 EMA (blue), adding confluence to the bearish bias.
Idea Summary:
Short Bias: Upon confirmation of the support level break (below 142.400).
Target: Around 139.872.
Confirmation: Look for bearish price action or retest/rejection from the support-turned-resistance area.

Buy Trade - USD/JPYGreetings to everyone!
Place a buy trade on USD/JPY and check out my chart for the ideal entry, stop-loss & target placement.
Remember :-
* Move your SL to breakeven once the trade reaches 1:1.4 R.
* Aim for a minimum reward of 1:1.5 R.
* Don't risk more than 3% of your total margin.
Let's execute this trade smartly! 🚀
💬 About Me:
I am a professional trader with over four years of experience in the markets. I focus on swing trading using the 4H timeframe, mainly in the forex space. The trades I share here are the actual positions I’m executing. I post them as a small gesture to give back to the trading community that’s been a big part of my journey.
Cheers! 🙏

USDJPY MULTI TIME FRAME ANALYSISHello traders , here is the full multi time frame analysis for this pair, let me know in the comment section below if you have any questions , the entry will be taken only if all rules of the strategies will be satisfied. wait for more price action to develop before taking any position. I suggest you keep this pair on your watchlist and see if the rules of your strategy are satisfied.
🧠💡 Share your unique analysis, thoughts, and ideas in the comments section below. I'm excited to hear your perspective on this pair .
💭🔍 Don't hesitate to comment if you have any questions or queries regarding this analysis.

USD/JPY) Bullish trand analysis Read The ChaptianSMC Trading point update
Technical analysis of USD/JPY on the 2-hour timeframe, and it presents a bullish continuation setup. Here's a breakdown of the key elements and the idea behind the analysis:
---
1. Ascending Channel Formation
The price is trading within an ascending channel, suggesting a controlled uptrend.
Higher highs and higher lows confirm the trend structure.
2. Key Support and Fair Value Gap (FVG)
There’s a well-identified support level where price has bounced before (highlighted in yellow).
A Fair Value Gap (FVG) zone is marked slightly above the support level, which could act as a short-term demand area.
Price is currently pulling back into this zone, potentially setting up a buying opportunity.
3. EMA 200 Support
The 200 EMA (~143.78) is acting as dynamic support just below the current price.
If price drops further, this level may offer strong technical support.
4. RSI Momentum
RSI is above 50 (currently 56.37), supporting the bullish trend and showing room for continued upside.
5. Target Point
The chart anticipates a bounce off the support/FVG zone and a rally toward the upper boundary of the channel, targeting 147.153.
Mr SMC Trading point
---
Summary of the Idea:
This is a bullish continuation setup within an uptrend channel. The analyst expects a potential long entry around the FVG/support zone, with a target at the channel top (147.15). Confluence from the EMA 200, RSI, and previous structure supports this bullish bias.
Pales support boost 🚀 analysis follow)

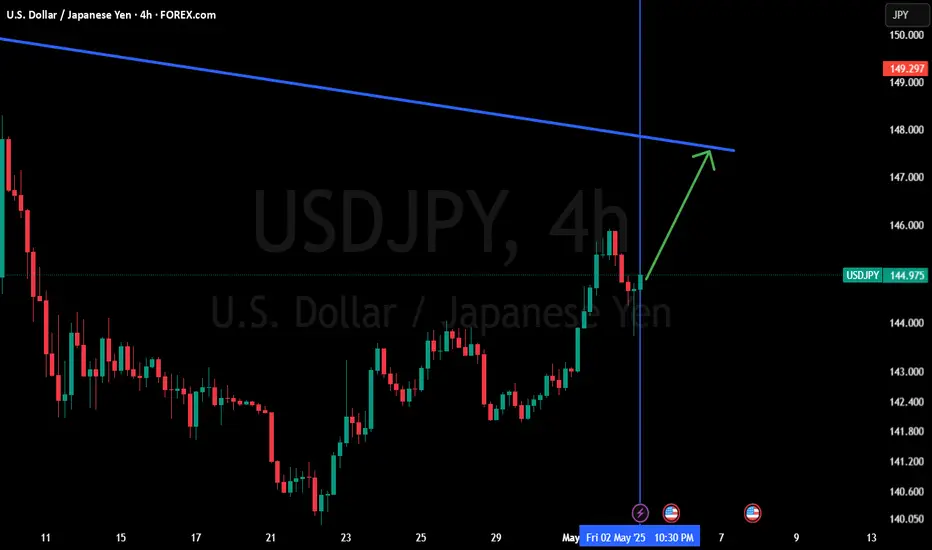
USD/JPY Weekly analysis (04-05-25 to - 10-05-25)🟨 USD/JPY – 4-Hour Outlook
📉 Move
USD/JPY is currently trading at 144.975 and could see an upside move toward 146.000–147.000 if bullish momentum holds.
📌 Reason
The pair is consolidating near 144.975, with potential support around 144.000.
A breakout above 145.086 (recent high) could confirm bullish continuation.
🔮 Outlook
Bullish scenario: A sustained move above 145.00 may target 146.00–147.00.
Bearish risk: Failure to hold 144.00 could lead to a drop toward 143.00–142.40.
📅 Next 24–48 Hours
Watch for a break and close above 145.00 for long entry confirmation.
Key resistance levels: 146.00, 147.00.
Key support levels: 144.00, 143.00.
USD JPY (1D)USD JPY IN 1 DAY TF
Bottom line is a major support line
curved line is a sign of creating reversals.
currently it consolidating, after a proper breakout or fakeout then need a confirmation like Hammer with bullish engulfing or Hanging Man with bullish engulfing..

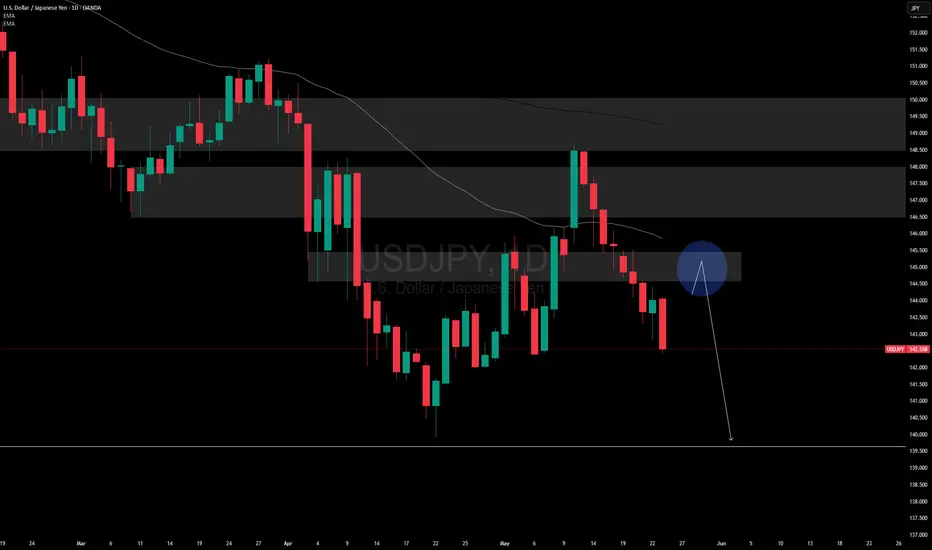
USD/JPY Bearish Breakdown: Trendline Breach and Retest TargetingChart Breakdown:
1. Rising Channel
⬆️ Uptrend inside a channel marked by a support line
Price moved up steadily within the boundaries
Support line = channel bottom (🔵 Blue line)
2. Trendline Breakout
⚠️ Bearish breakout occurred when price broke below the support
This is a sell signal as it invalidates the upward trend.
3. Retest Zone (Resistance)
After the breakout, price came back to test the previous support — now resistance
🔄 Retest happened inside the blue box zone
This zone is crucial — if price fails here, it confirms resistance.
4. EMA 70 (Exponential Moving Average)
🔴 Red curve = EMA 70, currently above price
This suggests downward momentum is building.
5. Target Point
🎯 Target = 139.869
Based on projected move from the breakout
🔽 Bearish target shown by vertical arrow.
Summary :
Trendline break: ✂️⬇️
Retest at resistance: 🔄❌
EMA direction: 🔴↘️
Final target: 🎯139.869
Current mood: 🐻 Bearish Bias
