"USD/JPY Supply Zone Short Setup | High R:R Trade Plan (1H Chart📉 Short (Sell) Setup
🔵 Supply Zone (Resistance Area)
Marked in the blue box
⚠️ Price may reverse here
Sellers dominated this area before.
🔄 Expected behavior:
Price goes up to the zone and then drops
➡️🔼🔽
🔹 Entry Point: 142.841
✍️ Enter a sell trade here
Right in the supply zone.
🔴 Stop Loss: 143.371
⛔ Placed above the supply zone
To avoid stop hunts.
🟣 Target Point: 140.000
🎯 Take profit here
Strong support level
Good place to close the trade.
⚖️ Risk to Reward Ratio
❗ Risk: ~53 pips
✅ Reward: ~284 pips
⭐ R:R = 1:5.4 – Excellent setup!
📈 EMA (7)
Current price is below the EMA
Confirms bearish bias
🧭 Used as a trend guide.
Summary
🚨 Plan:
Wait for price to enter the supply zone
Enter a sell at 142.841
SL at 143.371 ⬆️
TP at 140.000 ⬇️
USDJPYTMSP trade ideas

USDJPYHello & welcome to this analysis
It failed to reverse from the Bullish Harmonic Cypher pattern.
Now next bullish harmonic pattern is the Alt Shark at 137.75 while 141.80 appears to be a very strong resistance now

USDJPY - Week 4 AprilStrong downtrend.
So far no signal or BOS to go up.
But sellers are exhausted.
So based on the projection we can take trade.
Take buy trade with 4H candle confirmation.
BOS also at 1H

USD/JPY Bullish Reversal Setup – Long Entry at 141.964 Targeting ahemdsaeed25: USD/JPY Long Setup – Eyeing 150.537 Target"
"Potential Bullish Reversal on USD/JPY"
"Swing Trade Alert: USD/JPY Long from 141.964"
"USD/JPY Breakout Play – Buy Zone Identified"
Let me know your tone preference (technical, casual, professional, etc.) and I can tailor the title further.
ahemdsaeed25: This chart is for the USD/JPY (U.S. Dollar / Japanese Yen) pair on the 1-hour timeframe, and it's displaying a bullish setup with a clear trade idea. Here's a breakdown of the analysis:
Key Components:
Current Price: Around 142.574.
Entry Point: 141.964
Stop Loss: 140.547
Take Profit / Target Point: 150.537
Reward-to-Risk Ratio: Favorable (approximately 5.94% upside, large potential move).
Indicators:
EMA 50 (Red Line): 142.798 — acting as near-term dynamic resistance.
EMA 200 (Blue Line): 144.699 — major resistance and a trend filter (downward trend visible).
Zone Analysis:
Support Zone (Purple Box near 141.964 - 140.547): This is the accumulation/buy zone.

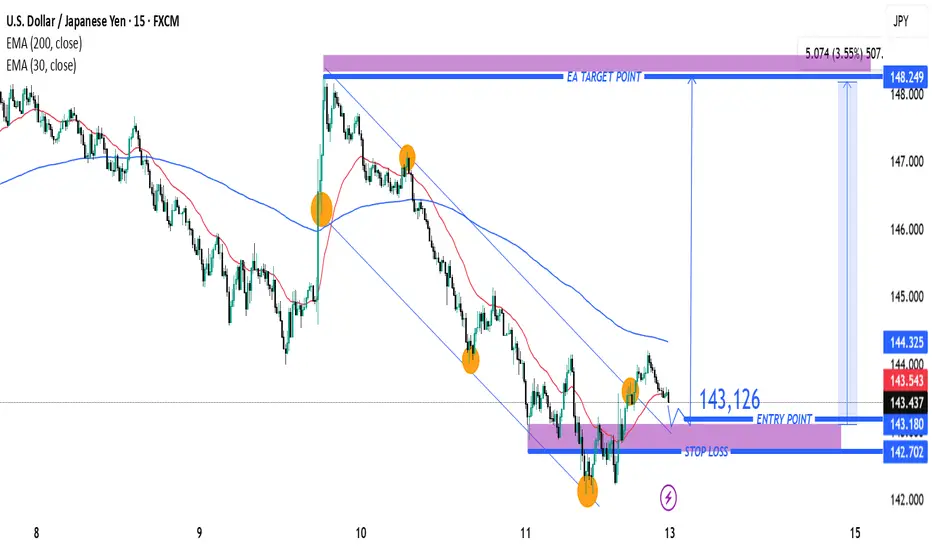
USD/JPY Bullish Breakout Setup – Entry, Stop Loss & Target AnalyPair: USD/JPY
Timeframe: 15 minutes
Indicators Used:
EMA (30-period) – Red line
EMA (200-period) – Blue line
Chart Features:
Downward channel (declining trendline)
Identified entry point, stop loss, and target
Key support/resistance zones shaded in purple
🟢 Trade Idea Summary:
🔹Entry Point: 143.126
🔹Stop Loss: 142.702
🔹Target (Take Profit): 148.249
🔹Risk/Reward Ratio: ~1:5 (Excellent R/R)
🔍 Technical Analysis:
✅ Bullish Breakout Signal
Price has broken above the descending channel and has retested the breakout area (highlighted purple zone) – a classic bullish breakout structure.
The breakout retest near 143.126 is acting as support, with potential to launch a new bullish move.
📈 Moving Average Analysis
EMA 30 is starting to flatten and curve up – indicating potential shift in momentum.
EMA 200 is still above price, but a breakout above it could strengthen the bullish case.
🔁 Support and Resistance
Strong support zone around 143.000 – 143.200 area (highlighted zone).
Major resistance and target zone is between 148.000 – 148.250.
🔔 Trade Plan Suggestion:
Go Long at or near 143.126
Place Stop Loss below support at 142.702
Target 148.249 for profit
Reasoning:
This setup offers a trend reversal potential from a downtrend to uptrend, with a clean breakout-retest-confirmation pattern. The wide take profit range gives room for extended upside as momentum builds.
⚠️ Watch For:
Reaction to the 144.325 (EMA 200) level
Increased buying volume to confirm breakout
Any re-entry into the channel (would invalidate setup)
USD/JPY Bearish Trade Setup – SBR + DBD Zone Rejection📉 Trend Analysis:
🔴 Downtrend confirmed by lower highs and lower lows.
📉 Descending trendline indicates continuous bearish pressure.
🔹 Key Levels & Zones:
🔵 Resistance Zone (SBR + DBD) – 144.123 📍 (Sell Entry Point)
🟠 Stop Loss – 145.209 🚫 (Above resistance to avoid fake breakouts)
🟢 Target Point – 139.694 🎯 (Strong support area)
🏹 Expected Price Action:
🔸 Scenario:
🔺 Price moves up toward the resistance zone (🔵 SBR + DBD Zone)
🔻 Bears take control (Rejection expected)
⚡ Drop towards target at 139.694
📊 Trade Plan:
✅ Entry – Wait for rejection at 144.123 (🔵)
✅ Stop Loss – Keep at 145.209 (🛑🔺)
✅ Take Profit – Aim for 139.694 (✅🎯)
💡 Risk-Reward Ratio: Good (More reward than risk)

JPY/USD Bullish Breakout – Targeting 0.0072802 After Retest (AprEntry Point: ~0.0069539
Take Profit (TP): 0.0072802
Stop Loss (SL): 0.0068579
Risk/Reward Ratio:
Risk: ~0.000096
Reward: ~0.000326
Approx. R/R = 1:3.4 → Excellent reward-to-risk
🧠 Strategy Insight
Trade Type: Long (Buy)
This is a bullish continuation setup aiming for higher highs after a breakout from a consolidation range.
Price Action:
Strong bullish trend visible since early April.
Price consolidated in a purple zone (likely a demand/support zone), then broke out and is now retesting that zone — classic breakout and retest pattern.
Indicators:
Two moving averages (likely 50 EMA in red and 200 EMA in blue) are in bullish alignment:
Price is above both EMAs.
50 EMA is above the 200 EMA, confirming bullish momentum.
Support & Resistance Zones:
Entry near previous resistance turned support — solid structure for long positioning.
TP zone near prior highs, possibly based on historical resistance (purple shaded zone above).
SL placed below the most recent demand zone and 200 EMA — a conservative and safe stop.
🔁 Trade Scenarios
✅ Bullish Outcome (Preferred):
Price respects the retest zone and pushes toward 0.0072802.
Strong momentum or fundamental catalysts could support the breakout continuation.
❌ Bearish Risk:
Price dips below the entry and breaks the demand zone and EMAs.
SL at ~0.0068579 helps manage this risk effectively.
🧩 Summary
This is a well-structured trend continuation long setup with textbook breakout-retest logic. The high R/R makes it an attractive opportunity assuming bullish conditions persist.
📌 Suggested Title
"JPY/USD Long Trade Setup – Breakout Retest Toward 0.0072802 (April 11, 2025)"
Bearish in USDJPYUSDJPY has broken a wonderful trendline in 3H chart and I will short it on any pullback upside with this trendline as SL. I feel final target must be in tune of 143. we can take help from OFA for a suitable selling point. Lets see what this forex pair has for us.

USD/JPY) bullish trend analysis Read The ChaptianSMC Trading point update
This chart is an analysis of the USD/JPY currency pair on a 2-hour timeframe, and it presents a possible bullish scenario. Here’s a breakdown of the idea:
---
Key Points of the Analysis:
1. Support Level & Change of Character (ChoCH):
Price found strong support around 144.556.
A ChoCH (Change of Character) is noted, indicating a potential shift from a bearish to a bullish trend.
2. Bullish Reversal Setup:
The price is forming higher lows, suggesting the start of a "New Up Trend".
There's a clear zig-zag bullish projection, suggesting potential long opportunities.
3. Target Zones:
The first target point is in the range of 149.692 – 150.493.
This area is also marked with a resistance zone, making it a logical TP (Take Profit) level.
4. Risk/Reward Ratio:
The risk is around -3.75% (-564.8 pips), and the reward is around +3.94% (+569.2 pips), suggesting a 1:1.05 R/R ratio.
5. RSI Indicator (Below):
RSI is showing a bullish divergence (price made lower lows while RSI made higher lows).
This divergence supports the idea of a possible bullish reversal.
6. 200 EMA:
The 200 EMA is at 148.767, acting as a dynamic resistance. Price may react around that level before hitting the final target zone.
Mr SMC Trading point
---
Conclusion:
This analysis suggests a potential long trade setup on USD/JPY based on:
A support zone,
Bullish RSI divergence,
Market structure shift (ChoCH),
And projected movement toward 149.692–150.493.
Idea: Buy near the support zone (~144.556) and target the resistance zone (~150.493) while managing risk carefully.
---
Pales support boost 🚀 analysis follow)

USD/JPY) Bullish reversal analysis Read The ChaptianSMC Trading point update
This chart is for USD/JPY on the 1-hour timeframe, and it presents a bullish trade setup. Let’s break down the idea
---
Key Observations:
1. Current Price:
USD/JPY is trading around 146.281.
2. Overall Bias:
Bullish setup expecting a bounce from demand into a higher target zone.
3. EMA 200:
Price is currently below the 200 EMA (147.942), which usually suggests a bearish trend — but this setup is aiming for a short-term bullish retracement.
4. Demand Zone (Buy Area):
Marked in yellow between 145.822 and slightly above.
Labeled as "FVG orders" (Fair Value Gap), suggesting institutional interest or imbalance fill.
5. Trendline Support:
The price is approaching a rising trendline, adding confluence for a potential bounce.
6. Expected Move:
Price is expected to bounce from the demand zone, form a higher low, and then move up toward the target zone at 148.221.
Two upside targets are drawn:
First Move: ~1.12% (30.6 pips)
Full Target: ~1.76% (256.1 pips)
Mr SMC Trading point
7. RSI (Relative Strength Index):
RSI is around 37.66, nearing oversold territory, supporting a bullish reversal idea.
---
Trade Idea Summary:
Bias: Bullish
Entry Zone: Around 145.822 (fair value gap & trendline support)
Target Zone: 148.221
Stop Loss: Likely just below the demand zone or trendline
Confluence Factors:
Trendline support
RSI nearing oversold
Fair value gap zone
EMA 200 overhead (target acts as resistance)
---
Pelas support boost 🚀 analysis follow

USDJPY shortsi am expecting dollar weakness in this week but we have to wait for CPI to release to have better direction for the dollar
untill now USDJPY will be bearish\

JPY/USD 30-Min Chart – Bearish Setup from Resistance Zone with 2200 EMA (blue): 0.0067930
30 EMA (red): 0.0068478
Current Price: 0.0068313
Price Position: Currently between the EMAs, showing consolidation and potential indecision.
🟪 Key Zones Identified
Entry Zone (Sell Area): Around 0.0068740
Stop Loss Zone: Above the resistance area at 0.0069118
First Target Zone (EA Resistance Point Target): Around 0.0067636
Final Target Zone (EA Target Point): Around 0.0066745
📉 Short Trade Plan
Entry Point: Price re-tests the resistance zone at 0.0068740
Stop Loss: Above key resistance at 0.0069118
Target 1 (TP1): 0.0067636
Target 2 (TP2): 0.0066745
Risk-to-Reward: Approx. 2.89x, with a -2.89% drop expected from entry to final target.
📊 Price Structure & Trend Insight
The chart shows bearish intent, with repeated rejections from the resistance zone.
A break below the 200 EMA and the support near 0.0067930 would signal stronger downside momentum.
The downward arrow and projection reflect a swing short setup based on market structure and key zones.
✅ Strategy Confirmation
Watch for:
Price rejection from the 0.0068740 level.
Bearish candlestick patterns in that zone (like bearish engulfing or shooting star).
Volume confirmation or momentum slowdown at resistance.

USD/JPY 4H Chart Analysis:Trend Break & Support-Based Long Setup1. Previous Uptrend Channel
📈
Price moved in a rising channel
Lower trendline acted as support ✅
Then came the trend line break ⚠️ — signal of trend reversal
2. Major Drop
🔻💥
After breaking support, the price fell sharply
Strong bearish momentum took over
Sellers dominated the market
3. Support Zone Identified
🟦 Support Box (146.110 - 145.156)
Buyers stepped in at this level
Possible bounce or consolidation
Price currently at 147.014 — just above support
4. Trade Setup Idea
🛒 Buy Opportunity (if price holds support)
📌 Entry Zone: Around 146.110
🎯 Target: 150.260
🛑 Stop Loss: 145.156
📊 Risk:Reward = ~1:2 — solid R:R setup!
5. Indicators & Confirmations
🟠 DEMA (9): Sitting at 146.110 — aligns with support!
✅ Extra confluence for the bounce!
Summary
If price holds above support:
Buyers might push toward 150.260
If it breaks below 145.156:
Sellers may regain control

USD/JPY BREAKS DOWN USD/JPY BREAKS DOWN – SAFE HAVEN YEN STRENGTHENS AS GLOBAL MARKETS REACT
After the latest U.S. tariff announcement, global financial markets went into risk-off mode, with U.S. Treasury yields dropping sharply. As investor fear rises, money quickly rotates into safe-haven assets — and the Japanese Yen is taking the spotlight.
🔻 USD/JPY just hit its lowest level in over 3 weeks, reflecting both global sentiment shifts and domestic tailwinds for the Yen.
🔍 What's Fueling Yen Strength?
Risk-off sentiment:
Global equities declined after the U.S. tariff update. Investors are fleeing risky assets, favoring traditional safe havens like the Yen.
Yield dynamics:
U.S. bond yields fell, dragging the dollar down.
If the Fed begins cutting rates to counteract trade impacts, it would further narrow the U.S.–Japan yield gap, supporting JPY.
BoJ policy outlook turning hawkish:
With inflation on the rise, expectations are growing that the Bank of Japan (BoJ) may continue rate hikes, reinforcing the Yen’s appeal.
Japan’s political stance:
Prime Minister Shigeru Ishiba announced intentions to revisit tariff policy negotiations with the U.S., potentially shaping Japan’s economic roadmap and investor confidence.
📈 Market Outlook:
If trade tensions persist and the Fed moves toward rate cuts, we could see further downside on USD/JPY, with JPY demand accelerating in both fundamental and technical terms.
This setup offers key opportunities for traders watching:
Safe-haven flow dynamics
Central bank divergence (Fed vs BoJ)
Potential macro breakout zones on JPY crosses
💬 What’s your view on USD/JPY heading into the next Fed and BoJ meetings?
Drop a comment and let’s discuss the bias!
✍️ Follow @MoneyMarketFlow for daily macro + technical insights across majors and metals.

USD/JPY Bullish Reversal: Order Block & EMA 200 TargetSMC Trading point update
This chart presents a technical analysis of USD/JPY on the 1-hour timeframe. The key insights from this analysis are:
1. Order Block & Potential Reversal
The price has dropped significantly and reached a highlighted order block zone (a key demand area).
A potential inverse head and shoulders pattern is forming, indicating a possible bullish reversal.
2. Expected Bullish Movement
The price is expected to bounce from the order block, creating a bullish structure.
The projected move suggests a retracement toward a resistance zone, which aligns with previous price action.
Mr SMC Trading point
3. Target Zone & EMA 200
The target zone is around 148.946 - 149.178, aligning with the 200 EMA, a significant resistance level.
4. RSI Indicator
The RSI is currently low (~38.93), indicating potential for a reversal as the market may be oversold.
Conclusion
The chart suggests a bullish retracement after the recent drop, targeting the resistance zone near the 200 EMA. However, confirmation is needed (e.g., bullish price action, volume increase) before taking a trade. Keep an eye on fundamental news that may impact USD/JPY volatility.
Pales support boost 🚀 analysis follow)

USDJPY- ATTEMPTING TREND REVERSALSymbol - USDJPY
CMP - 148.87
The USDJPY is currently in a corrective phase, retesting the previously breached downtrend boundary. The market is attempting to break this trend amidst a broader correction of the US dollar.
The dollar is facing significant challenges due to various economic and geopolitical factors in the United States, coupled with persistently high inflation. In light of these conditions, the US dollar Index may continue to experience a deeper correction, as expectations for interest rate cuts could be extended, potentially exerting further pressure on the markets.
Earlier, the currency pair attempted to overcome the resistance of the downtrend and succeeded, yet this move alone is insufficient to confirm a trend reversal; additional confirmation is required.
Support levels: 148.92, 148.21
Resistance levels: 150.16, 150.95
If the bulls manage to maintain support above the 148.92 - 149.5 range, there is a promising opportunity for a potential trend reversal. A move towards the 150.16 resistance level, followed by a breakout and sustained price action above this level, would serve as confirmation of the trend shift.
USDJPY Analysis 💹 USDJPY Analysis 💹
🔹 Currently at Fibonacci support zone 📏
🔹 Further weakness if sustained below 148.620, next Fibonacci support at 147.301 📉
🔹 Resistance near 149.564 🔼
🔹 A bounce near these levels can also be used for shorting 🎯
⚡ Watch these levels closely! 👀

USDJPY shortswill USDJPY go down after the BOJ been hawkish ?? it is on bullish structure still but lets see this week

Waiting for bullish moveHere is the detailed analysis for a bullish trade setup on USD/JPY (4H timeframe):
Key Observations:
1. Resistance Zone (151.000-152.000)
- The price has rejected this level three times (as marked in red).
- This suggests strong resistance, and a breakout would indicate a strong bullish move.
2. Ascending Trendline Support
- The price has bounced off the trendline five times (marked in blue).
- However, a breakdown of this trendline could signal bearish movement.
3. Fibonacci Retracement (0.5 - 0.618 Level)
- The retracement zone aligns with a previous resistance level, now acting as support .
- This increases the probability of a bullish reversal.
4. Entry Confirmation Criteria:
- Wait for a strong green 4-hour candle with high volume near the 149.000 - 149.500 support area.
- If price respects the Fibonacci level and forms a bullish engulfing or strong pin bar, it confirms bullish momentum.
Trade Plan for Bullish Entry:
- Entry: Around 149.000 - 149.500 , once a bullish confirmation candle forms.
- Stop Loss (SL): Below 148.500 (below Fibonacci 0.618 level & previous structure).
- Take Profit (TP):
- TP1: 150.500 (near the trendline break level).
- TP2: 151.500 - 152.000 (major resistance zone).
Risk Management:
- Risk-reward ratio should be at least 1:2 .
- If price breaks below 148.500 , reconsider the bullish bias.
Conclusion:
- The setup favors a bullish trade only if a strong reversal candle appears at the Fibonacci & support zone.
- A breakout above 151.500 - 152.000 could trigger a bigger bullish rally.
Follow me for more ideas :)

USDJPY MULTI TIME FRAME ANALYSISHello traders , here is the full multi time frame analysis for this pair, let me know in the comment section below if you have any questions , the entry will be taken only if all rules of the strategies will be satisfied. wait for more price action to develop before taking any position. I suggest you keep this pair on your watchlist and see if the rules of your strategy are satisfied.
🧠💡 Share your unique analysis, thoughts, and ideas in the comments section below. I'm excited to hear your perspective on this pair .
💭🔍 Don't hesitate to comment if you have any questions or queries regarding this analysis.

USD/JPY Bullish Trade Setup – Key Support & Target ProjectionThe chart represents a USD/JPY (U.S. Dollar / Japanese Yen) 30-minute timeframe trade setup. Below is the analysis:
Technical Analysis:
Key EMAs:
200 EMA (Blue Line): 150.367 – Serves as dynamic support.
30 EMA (Red Line): 150.753 – Currently acting as resistance.
Support & Resistance Zones:
Entry Zone: 150.356 - 150.367 (Highlighted in purple).
Stop Loss: 150.022 (Below the key support).
Target Point: 151.269 (Near previous highs).
Market Structure & Price Action:
The price is pulling back into the highlighted demand zone.
A possible bullish reaction is expected at this level, leading to an upside push toward 151.269.
If the support holds, the price may bounce and confirm an uptrend continuation.
Trade Plan:
Entry: Around 150.367 after confirmation of price rejection.
Stop Loss: Below 150.022 (to protect against downside risk).
Take Profit: 151.269 (Aligns with previous high and resistance).
Conclusion:
The setup favors a buy trade if price action confirms a bounce from the demand zone.
A break below the stop-loss level may invalidate the setup, signaling a potential bearish continuation.

USDJPYA textbook setup. As you can see price came int the 4H Demand zone. It made push down and 15min trading range. Now waiting for the high of that range to be taken out and price to sustain above for a while and then return back and continue higher.
If you look on 5min, price already provided intraday setup to the left but to get odds into my favour I waut for 15min BOS. Lets wait and see what happens. If not you know, when price does not break the high it will break the low.
Blessings, T

SLOVENSKA ANALIZA EURUSD, USDJPYSlovenian analyisis for EurUsd and UsdJpy. After recording video in English, I wanted to give you the same explenation maybe even more detailed in Slovene. Enjoy!
