USDSGD - LONG TRADE FOR HUGE PROFITSymbol - USDSGD
USDSGD is currently trading at 1.3150
I'm seeing a trading opportunity on buy side.
Buying USDSGD pair at 1.3150
I will be adding more if 1.3080 comes & will hold with SL 1.3030
Targets I'm expecting are 1.3385 - 1.3560
Disclaimer - Do not consider this as a buy/sell recommendation. I'm sharing my analysis & my trading position. You can track it for educational purposes. Thanks!
USDSGD trade ideas

USDSGD NEXT MOVE, Possible bullish move (mid term) (06-12-2023)Go through the analysis carefully, and do trade accordingly.
Anup 'BIAS for the Pair
if price managed to close above 1.34250 (this trendline and resistance), then we can see the bullish momentum in the price.
Entry- should be taken only after break of trendline & resistance
TP-1 35100
TP-2 36300
SL- below the swing low
Our trading Preference
Trading tips: (Accuracy 90%)
USDSGD Sell/Buy @NA
TP@NA
SL@NA
Best of luck
Never risk 2% of principal to follow any position.
Support us by liking and sharing the post.

USDSGD SHOORT SEEING THE previous trend and using fib we can see a short side on USDSGD and dollar at resistance

💡Don't miss the great buy opportunity in USDSGDTrading suggestion:
". There is a possibility of temporary retracement to the suggested support line (1.3463).
. if so, traders can set orders based on Price Action and expect to reach short-term targets."
Technical analysis:
. USDSGD is in a range bound, and the beginning of an uptrend is expected.
. The price is above the 21-Day WEMA, which acts as a dynamic support.
. The RSI is at 71.
Take Profits:
TP1= @ 1.3508
TP2= @ 1.3549
TP3= @ 1.3605
TP4= @ 1.3668
TP5= @ 1.3713
SL= Break below S2
❤️ If you find this helpful and want more FREE forecasts in TradingView
. . . . . Please show your support back,
. . . . . . . . Hit the 👍 LIKE button,
. . . . . . . . . . Drop some feedback below in the comment!
❤️ Your support is very much 🙏 appreciated!❤️
💎 Want us to help you become a better Forex / Crypto trader?
Now, It's your turn!
Be sure to leave a comment; let us know how you see this opportunity and forecast.
Trade well, ❤️
ForecastCity English Support Team ❤️

💡Don't miss the great buy opportunity in USDSGDTrading suggestion:
". There is a possibility of temporary retracement to the suggested support line (1.3420).
. if so, traders can set orders based on Price Action and expect to reach short-term targets."
Technical analysis:
. USDSGD is in a range bound, and the beginning of an uptrend is expected.
. The price is below the 21-Day WEMA, which acts as a dynamic resistance.
. The RSI is at 40 .
Take Profits:
TP1= @ 1.3440
TP2= @ 1.3466
TP3= @ 1.3489
TP4= @ 1.3515
TP5= @ 1.3550
TP6= @ 1.3605
SL= Break below S2
❤️ If you find this helpful and want more FREE forecasts in TradingView
. . . . . Please show your support back,
. . . . . . . . Hit the 👍 LIKE button,
. . . . . . . . . . Drop some feedback below in the comment!
❤️ Your support is very much 🙏 appreciated!❤️
💎 Want us to help you become a better Forex / Crypto trader?
Now, It's your turn!
Be sure to leave a comment; let us know how you see this opportunity and forecast.
Trade well, ❤️
ForecastCity English Support Team ❤️

Optimistic TradeMessage me to learn 1 to 1!
USDGSD 15M TF
After a long trendline we can finally see another false breakout,
This can give a great move and we can get a nice bullish wave
However only if we see successful re test!
RR-4

💡Don't miss the great buy opportunity in USDSGDTrading suggestion:
". There is a possibility of temporary retracement to the suggested support line (1.3580).
. if so, traders can set orders based on Price Action and expect to reach short-term targets."
Technical analysis:
. USDSGD is in an uptrend, and the continuation of the uptrend is expected.
. The price is above the 21-Day WEMA, which acts as a dynamic support.
. The RSI is at 79.
Take Profits:
TP1= @ 1.3706
TP2= @ 1.3784
TP3= @ 1.3859
TP4= @ 1.3935
TP5= @ 1.3975
SL= Break below S2
❤️ If you find this helpful and want more FREE forecasts in TradingView
. . . . . Please show your support back,
. . . . . . . . Hit the 👍 LIKE button,
. . . . . . . . . . Drop some feedback below in the comment!
❤️ Your support is very much 🙏 appreciated!❤️
💎 Want us to help you become a better Forex / Crypto trader?
Now, It's your turn!
Be sure to leave a comment; let us know how you see this opportunity and forecast.
Trade well, ❤️
ForecastCity English Support Team ❤️

Quick Trade!USDGSD 15 Minutes
rising triangle can be seen
However a Bearish RSI divergence is also seen,
It has been building since the start and a lower breakout may be seen now
A good entry can be taken now
With a small SL of the current Candles high
TGT can be set at 1.349 which is a strong demand zone
RR-4
Possible Pips-0.0024
However, be cautious of a bounce-back!
Message me if you'd like to work with me!

💡Don't miss the great buy opportunity in USDSGDTrading suggestion:
". There is a possibility of temporary retracement to the suggested support line (1.3382).
. if so, traders can set orders based on Price Action and expect to reach short-term targets."
Technical analysis:
. USDSGD is in an uptrend, and the continuation of the uptrend is expected.
. The price is above the 21-Day WEMA, which acts as a dynamic support.
. The RSI is at 40 .
Take Profits:
TP1= @ 1.3467
TP2= @ 1.3510
TP3= @ 1.3557
TP4= @ 1.3617
TP5= @ 1.3668
SL= Break below S2
❤️ If you find this helpful and want more FREE forecasts in TradingView
. . . . . Please show your support back,
. . . . . . . . Hit the 👍 LIKE button,
. . . . . . . . . . Drop some feedback below in the comment!
❤️ Your support is very much 🙏 appreciated!❤️
💎 Want us to help you become a better Forex / Crypto trader?
Now, It's your turn!
Be sure to leave a comment; let us know how you see this opportunity and forecast.
Trade well, ❤️
ForecastCity English Support Team ❤️

💡Don't miss the great buy opportunity in USDSGD
Trading suggestion:
". There is a possibility of temporary retracement to the suggested support line (1.33851).
. if so, traders can set orders based on Price Action and expect to reach short-term targets."
Technical analysis:
. USDSGD is in a range bound, and the beginning of an uptrend is expected.
. The price is above the 21-Day WEMA, which acts as a dynamic support.
. The RSI is at 74.
Take Profits:
TP1= @ 1.34828
TP2= @ 1.35317
TP3= @ 1.35762
TP4= @ 1.36323
TP5= @ 1.36743
SL= Break below S2
❤️ If you find this helpful and want more FREE forecasts in TradingView
. . . . . Please show your support back,
. . . . . . . . Hit the 👍 LIKE button,
. . . . . . . . . . Drop some feedback below in the comment!
❤️ Your support is very much 🙏 appreciated! ❤️
💎 Want us to help you become a better Forex / Crypto trader ?
Now, It's your turn !
Be sure to leave a comment; let us know how you see this opportunity and forecast.
Trade well, ❤️
ForecastCity English Support Team ❤️

💡Don't miss the great buy opportunity in USDSGDTrading suggestion:
". There is a possibility of temporary retracement to suggested support line (1.3246).
. if so, traders can set orders based on Price Action and expect to reach short-term targets."
Technical analysis:
. USDSGD is in a range bound and the beginning of uptrend is expected.
. The price is above the 21-Day WEMA which acts as a dynamic support.
. The RSI is at 56.
Take Profits:
TP1= @ 1.3276
TP2= @ 1.3307
TP3= @ 1.3330
TP4= @ 1.3350
TP5= @ 1.3377
SL= Break below S2
❤️ If you find this helpful and want more FREE forecasts in TradingView
. . . . . Please show your support back,
. . . . . . . . Hit the 👍 LIKE button,
. . . . . . . . . . Drop some feedback below in the comment!
❤️ Your Support is very much 🙏 appreciated!❤️
💎 Want us to help you become a better Forex / Crypto trader?
Now, It's your turn!
Be sure to leave a comment let us know how you see this opportunity and forecast.
Trade well, ❤️
ForecastCity English Support Team ❤️
USDSGD-Will make a 5 waves to 1.36 or decline to 1.29 for (Z) ?Dear friends,
Don't follow me blindly...what i am sharing here, is my knowledge not signals
I am sharing my view through Elliott waves from past 4 yrs....i learned tons and tons here and market taught me lot and still teaching and i am listening to the market...and i am getting a lot of PM's regarding NEGATIVE COMMENTS from my friends...i am sharing here my view for a educational purpose and i am still a learner and i am sharing not my only my view and my experience if u PURELY LISTENNED to my MARKET COMMENTARY... i am not a market mover...just i am keep changing my view according to the PRICE ACTION and i written detailly about that in market commentary...there is no short cut to earn money and cant make a fast cash...if u do that also it may go like that....
My ambition is to create an awareness to the traders, to promote the education not to do BLINDLY...If u look my past 4 yrs chart and now...i fine tuned or refined my strategy...and still looking for finetune...so if u r following my trade plans as a signal its not my fault...If you are not encouraging also not mind but dont discourage...if you are not comment also dont leave the negative comments, if you are not motivate also dont demotivate...because NAGATIVE is more powerful than POSITIVE...i wont care about such comments...because of your comments i wont stop anything in MY PRACTICE...it will take time and to digest such comments for first 2-3 days and again i rebuilt my positive activity and my view and then again i keep start my sharing...i dont need a roadblocks in my journey. If it happen also i need to cross that and i continue...but that crossing time is DELAY for my journey to reach my GOAL...so try to be a friend...just learn or leave .if you didnt like a page in your story book just turn that... Don't look that, Like that dont look my chart...just skip that...thanks lot ...here some quotes by BRUCE LEE...
1. I fear not the man who has practiced 10,000 kicks once, but i fear the man who has practiced one kick 10,000 times "
2. A GOAL is not always meant to be reached, it often serves simply as something to AIM at
3. Those who are UNAWARE they are walking in darkness will never seek the light
4. To hell with circumstances i create the opportunities
5. I don't teach you anything. I just help you to know yourself
6. Always be yourself, express yourself, have a faith in yourself, do not go out and look for a successful personality and duplicate it.
7. Don't fear failure... in great attempts it is glorious even to fail
8. Absorb what is useful, reject what is useless, add what is specifically your own
9. Notice that stiffest tree is most easily cracked, while the bamboo or willow survives by bending with the wind
10. The successful warrior is the average man with laser-like FOUCS -
Market Commentary:
LEARNING ELLIOTT WAVES IS LITTLE BIT TOUGH (FOR ME IN BEGINNING) BUT I TOOK IT AS A CHALLENGE AND THAT IS NOT IMPOSSIBLE ALSO...
First have an look for the positional trend i shared here previous....if you are a follower of me...and sometimes i will share the counter trend trade also in 15 mins and 1hr...but that is risky ones...so if the trend is bearish or bullish, if i am expecting the correction...book the profit there and wait the correction to end and again go with the trend....DONT TRADE THE COUNTER TRADE SETUP...you will took loss too...try to identify the short term pull back and the long term pull back after that took small lots in the short term PB with strict stop and go with big lots in the trend side that is long term. I WONT TOOK ALL THE TRADE PLAN SHARED HERE...
Read the market commentary inside the chart what i shared here carefully and try to learn Elliott waves...otherwise its tough to understand the market commentary and my analysis. I wont give a entry, stop loss and take profit in my chart...it is only for EDUCATIONAL PURPOSE and i am sharing how i am analyzing the pair and labeling them according to the Elliott wave theory...I AM JUST SHOWING THE TREND HOW IT MAY GO AND MY VIEW(it may wrong too)..so DON'T FOLLOW BLINDLY MY CHART..take this as a reference and if it correlate to you strategy took the trade as per your strategy...DON'T ASK ABOUT YOUR RUNNING TRADES i wont comment on them and I WONT SUGGEST TO TAKE MY TRADE SETUP.
I am a technical analyst based on trendline, channel, fib retracements, expansion, stochastic for divergence, EMA's and MA's are finding the pull backs and MAJOR IS ELLIOTT WAVES...those mentioned above are using as a TOOLS only. I am not a fundamental, sentimental trader...but only the fundamental will boost my technical analysis to reach my target or sometimes it will go against me and then i will manage the trade according to the Elliott waves alternate views...Each and every trade plan i am sharing here has a alternate view and i am sharing only the most probabilities(70-80%) here...sometimes the other (20-30%) may market do..then i will change the wave counts and labeling according to the price action.
All labeling and wave counts done by me by manually and i will keep change according to the LIVE MARKET PRICE ACTION. So dont bias, hope on my trade plans...try to learn and make your own strategy...Following is not that much easy...I AM NOT RESPONSIBLE FOR ANY LOSSES IF U TOOK THE TRADE ACCORDING TO MY TRADE PLANS....THANKS LOT..CHEERS

It's a great buy opportunity in USDSGDTrading suggestion:
. There is a possibility of temporary retracement to suggested support line (1.3335). if so, traders can set orders based on Price Action and expect to reach short-term targets.
Technical analysis:
. USDSGD is in a range bound and the beginning of uptrend is expected.
.The price is above the 21-Day WEMA which acts as a dynamic support.
. The RSI is at 75.
Take Profits:
TP1= @ 1.3470
TP2= @ 1.3525
TP3= @ 1.3555
TP4= @ 1.3615
TP5= @ 1.3705
SL= Break below S2
❤️ If you find this helpful and want more FREE forecasts in TradingView
. . . . . Please show your support back,
. . . . . . . . Hit the 👍 LIKE button,
. . . . . . . . . . . Drop some feedback below in the comment!
❤️ Your Support is very much 🙏 appreciated! ❤️
💎 Want us to help you become a better Forex trader ?
Now, It's your turn !
Be sure to leave a comment let us know how do you see this opportunity and forecast.
Trade well, ❤️
ForecastCity English Support Team ❤️

💡Don't miss the great buy opportunity in USDSGDTrading suggestion:
". There is a possibility of temporary retracement to suggested support line (1.33410).
. if so, traders can set orders based on Price Action and expect to reach short-term targets."
Technical analysis:
. USDSGD is in a range bound and the beginning of uptrend is expected.
. The price is above the 21-Day WEMA which acts as a dynamic support.
. The RSI is at 68.
Take Profits:
TP1= @ 1.33890
TP2= @ 1.34390
TP3= @ 1.35010
TP4= @ 1.35500
TP5= @ 1.36170
SL= Break below S2
❤️ If you find this helpful and want more FREE forecasts in TradingView
. . . . . Please show your support back,
. . . . . . . . Hit the 👍 LIKE button,
. . . . . . . . . . Drop some feedback below in the comment!
❤️ Your Support is very much 🙏 appreciated! ❤️
💎 Want us to help you become a better Forex trader ?
Now, It's your turn !
Be sure to leave a comment let us know how you see this opportunity and forecast.
Trade well, ❤️
ForecastCity English Support Team ❤️

💡Don't miss the great buy opportunity in USDSGDMidterm forecast:
While the price is above the support 1.2995, beginning of uptrend is expected.
We make sure when the resistance at 1.3460 breaks.
If the support at 1.2995 is broken, the short-term forecast -beginning of uptrend- will be invalid.
Technical analysis:
The RSI downtrend #1 is broken, so the probability of beginning of uptrend is increased.
A trough is formed in daily chart at 1.3146 on 01/06/2021, so more gains to resistance(s) 1.3335, 1.3390 and maximum to Major Resistance (1.3460) is expected.
Price is above WEMA21, if price drops more, this line can act as dynamic support against more losses.
Relative strength index (RSI) is 53.
Take Profits:
Take Profits:
TP1 @ 1.3335
TP2 @ 1.3390
TP3 @ 1.3460
TP4 @ 1.3675
TP5 @ 1.3785
TP6 @ 1.4035
TP7 @ 1.4635
TP8 Free
❤️ If you find this helpful and want more FREE forecasts in TradingView
. . . . . Please show your support back,
. . . . . . . . Hit the 👍 LIKE button,
. . . . . . . . . . . Drop some feedback below in the comment!
❤️ Your Support is very much 🙏 appreciated! ❤️
💎 Want us to help you become a better Forex trader ?
Now, It's your turn !
Be sure to leave a comment let us know how do you see this opportunity and forecast.
Trade well, ❤️
ForecastCity English Support Team ❤️

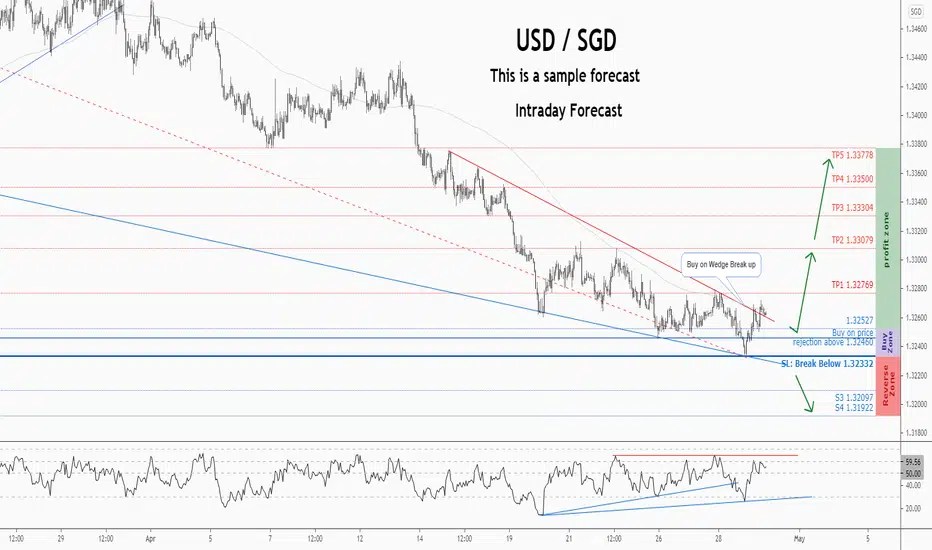
USDSGD Plays for a Upside Break from Descending Broadening WedgeUSDSGD has been forming lower highs and lower lows within the Descending Broadening Wedge Pattern, since 9th December. After testing the upper trend line for the fourth consecutive time, prices registered a breakout and have sustained above the pattern. Moreover, the formation of Three White soldiers candlestick pattern, confirms the potential uptrend in the pair. In addition, the red signal line of the Custom Moving Averages indicator is trading below the prices, thus indicating of bullishness in the pair. The prices are now attempting to move towards its target profit and thus traders can grab the buy opportunity and keep the profit target at 1.34769 level. Simultaneously, the stop loss can be set at 1.33143 level.
Trade information
Take profit 1.34769
Stop-loss 1.33143

💡Don't miss the great buy opportunity in USDSGDMidterm forecast:
While the price is above the support 1.3400, beginning of uptrend is expected.
We make sure when the resistance at 1.3885 breaks.
If the support at 1.3400 is broken, the short-term forecast -beginning of uptrend- will be invalid.
Technical analysis:
There is a divergence in RSI and price between the trough at 1.3549 on 2020-09-01 and the trough at 1.3512 on 2020-10-22, the probability of downtrend continuation is decreased and the probability of beginning of uptrend is increased.
While the RSI downtrend #1 is not broken, bearish wave in price would continue.
A trough is formed in daily chart at 1.3510 on 10/22/2020, so more gains to resistance(s) 1.3550, 1.3675, 1.3785 and maximum to Major Resistance (1.3885) is expected.
Price is below WEMA21, if price rises more, this line can act as dynamic resistance against more gains.
Relative strength index (RSI) is 35.
Take Profits:
TP1 @ 1.3550
TP2 @ 1.3675
TP3 @ 1.3785
TP4 @ 1.3885
TP5 @ 1.4270
TP6 @ 1.4635
TP7 Free
❤️ If you find this helpful and want more FREE forecasts in TradingView
. . . . . Please show your support back,
. . . . . . . . Hit the 👍 LIKE button,
. . . . . . . . . . . Drop some feedback below in the comment!
❤️ Your Support is very much 🙏 appreciated! ❤️
💎 Want us to help you become a better Forex trader ?
Now, It's your turn !
Be sure to leave a comment let us know how do you see this opportunity and forecast.
Trade well, ❤️
ForecastCity English Support Team ❤️

Don't miss the great buy opportunity in USDSGDMidterm forecast:
. While the price is above the support 1.3430, beginning of uptrend is expected.
. We make sure when the resistance at 1.3754 breaks.
. If the support at 1.3430 is broken, the short-term forecast -beginning of uptrend- will be invalid.
Technical analysis:
. The RSI downtrend #1 is broken, so the probability of beginning of uptrend is increased.
. A peak is formed in daily chart at 1.3985 on 06/22/2020, so more losses to support(s) 1.3550 and minimum to Major Support (1.3430) is expected.
. Price is below WEMA21, if price rises more, this line can act as dynamic resistance against more gains.
. Relative strength index (RSI) is 42.
Take Profits:
TP1= @1.3754
TP2= @1.3885
TP3= @1.4035
TP4= @1.4270
TP5= @1.4635
TP6 Free
❤️ If you find this helpful and want more FREE forecasts in TradingView
. . . . . Please show your support back,
. . . . . . . . Hit the 👍 LIKE button,
. . . . . . . . . . Drop some feedback below in the comment!
❤️ Your Support is very much 🙏 appreciated! ❤️
💎 Want us to help you become a better Forex trader ?
Now, It's your turn !
Be sure to leave a comment let us know how do you see this opportunity and forecast.
Trade well, ❤️
ForecastCity English Support Team ❤️

Don't miss the great buy opportunity in USDSGDTrading suggestion:
. There is a possibility of temporary retracement to suggested support line (1.367). if so, traders can set orders based on Price Action and expect to reach short-term targets.
Technical analysis:
. USDSGD is in a range bound and the beginning of uptrend is expected.
. The price is below the 21-Day WEMA which acts as a dynamic resistance.
. The RSI is at 44.
Take Profits:
TP1= @ 1.3786
TP2= @ 1.3916
TP3= @ 1.4087
TP4= @ 1.4260
TP5= @ 1.4547
SL= Break below S2
❤️ If you find this helpful and want more FREE forecasts in TradingView
. . . . . Please show your support back,
. . . . . . . . Hit the 👍 LIKE button,
. . . . . . . . . . . Drop some feedback below in the comment!
❤️ Your Support is very much 🙏 appreciated! ❤️
💎 Want us to help you become a better Forex trader ?
Now, It's your turn !
Be sure to leave a comment let us know how do you see this opportunity and forecast.
Trade well, ❤️
ForecastCity English Support Team ❤️

USDSGD multi frame analysis. Possible upmove.Hello Trader, Here is the full analysis of USDSGD :
1) On the 4hr chart we can see it as formed Cypher pattern and possible reversal expected.
2) Price is in a strong support zone and can test this zone for up move and if it respects this zone one can expect up move in the stock .
3) If it breaks the support then wait for the next retracement downside to take short position.
How can you support me:
1) Like my idea.
2) Follow me for more analysis
Feedback:
Please share your feedback in comments and this will help me to improve my drawing and analysis

Don't miss the great buy opportunity in USDSGDTrading suggestion:
. There is a possibility of temporary retracement to suggested support line (1.4162). if so, traders can set orders based on Price Action and expect to reach short-term targets.
Technical analysis:
. USDSGD is in a range bound and the beginning of uptrend is expected.
.The price is above the 21-Day WEMA which acts as a dynamic support.
. The RSI is at 65.
Take Profits:
TP1= @ 1.4300
TP2= @ 1.4402
TP3= @ 1.4635
SL= Break below S2

USDSGD beautiful looking patternUSDSGD is making some kind of a price action pattern and now it is likely to go and touch the upper circuit of the pattern , if we get a clear confirmation , we can take a sell

