USDT.D AnalysisThe USDT Dominance (USDT.D) remains in its broader downtrend and is currently testing the key 4.19% support. A confirmed breakdown of this level would validate further downside in dominance and provide a strong bullish catalyst for the crypto market, as capital flows out of stablecoins into risk ass
Key data points
Previous close
—
Open
—
Day's range
—
About Market Cap USDT Dominance, %
Coin
Tether is considered a pioneer of the stablecoin model. As such, it's pegged to an external asset, US dollar, which lets it combine the stability of the real-world investment tools and the earning potential of a cryptocurrency. Looks reliable (if you can call any crypto assets that), which is probably why its share on the market has been growing since its launch way back in 2014. You can see for yourself, just look at the USDT dominance chart we've prepared — it reflects the ratio of Tether market cap to the cumulative market cap of the crypto market.
USDT Dominance Forming Triple Bottom – Bearish SignalUSDT Dominance is showing a triple bottom formation on the daily timeframe – a pattern that historically signals a potential reversal or bounce. Each time USDT.D has tested this region in the past, we've seen a strong bounce in dominance, often followed by pullbacks in BTC and altcoins due to their
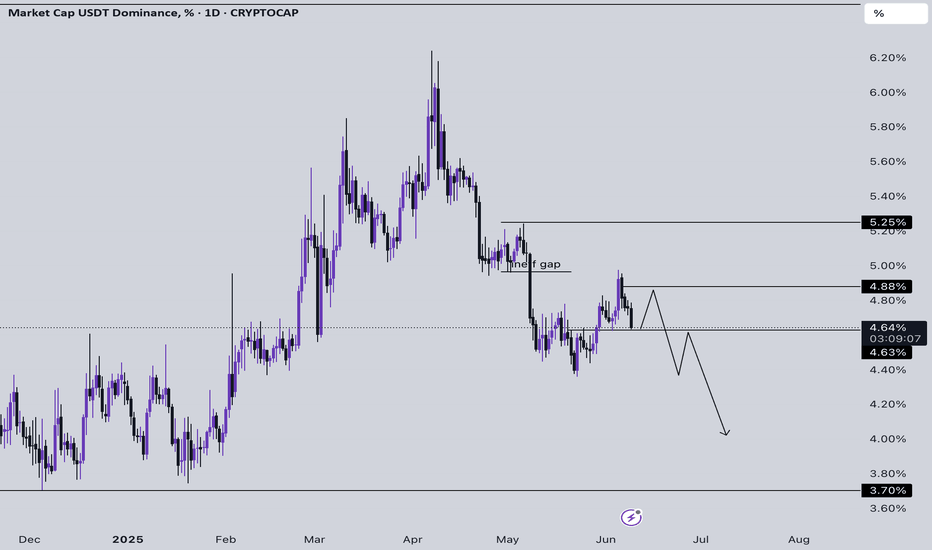
USDT Dominance Crypto Path & Commentary for Bull Run- USDT D is currently trading at 4.64% and looks bearish from a Market Structure Shift
- USDT D can now soon move towards 4.88% and purge that to trap late longs and that should be the last bounce before we drop to 3.7%
- Another case is if we don't see USDT getting rejected badly from 4.88% then w
USDT.D BULLISH DIVERGENCE SET TO BLEED BTCCRYPTOCAP:USDT.D has formed a bullish divergence and a clear double bottom with proper higher lows, signaling a potential surge toward the 4% to 4.10% resistance area. This movement could lead to a significant drop in BTC and altcoins, as USDT.D and the crypto market are inversely correlated.
USDT.D DOUBLE BOTTOM & BULLISH DIVERGENCE , POSSIBLE RETEST 4.7%#USDT dominance ( CRYPTOCAP:USDT.D ) has formed a double bottom on the higher timeframe, aligning with another double bottom visible on the daily timeframe. The RSI is showing a clear bullish divergence, further strengthening the probability of a retest toward the 4.7% resistance area from the curre
USDT.D RSI Oversold, Expected Bounce to 5%-5.5%, Bearish for BTCCRYPTOCAP:USDT.D shows signs of a potential bounce as RSI has reached oversold territory, indicating a likely move up to the 5%-5.5% area.
With #USDT.D rising, we expect #Bitcoin and altcoins to face downward pressure due to the inverse relationship between USDT dominance and the broader crypto m
Crypto USDT Dominance Update & Commentary- USDT Dominance is currently trading at 4.61%
- USDT Dominance works inversely with the Crypto Market
- If you see USDT Dominance falling and being bearish then are high chances of crypto moving up impulsively
- Current Market Structure of USDT Dominance looks highly bearish
- We can expect USDT
USDT Dominance Crypto Update - The USDT Dominance is currently trading at 5.58%
- USDT Dominance is something that follows market structure a lot and you will see this delivering easy price actions
- USDT Dominance is expected to drop to 5.2%, and if that doesn't hold, then to 4.6%.
- USDT Dominance in crypto works inversely
USDT.D FORMING BEARISH DIVERGENCE IN DAILY TIME FRAMEUSDT.D ( CRYPTOCAP:USDT dominance) appears to be forming a double top pattern on the chart, signaling potential weakness. This is further confirmed by bearish divergence on the RSI, where price action is making similar highs, but momentum is decreasing, indicating the possibility of a reversal.
If
See all ideas
Summarizing what the indicators are suggesting.
Oscillators
Neutral
SellBuy
Strong sellStrong buy
Strong sellSellNeutralBuyStrong buy
Oscillators
Neutral
SellBuy
Strong sellStrong buy
Strong sellSellNeutralBuyStrong buy
Summary
Neutral
SellBuy
Strong sellStrong buy
Strong sellSellNeutralBuyStrong buy
Summary
Neutral
SellBuy
Strong sellStrong buy
Strong sellSellNeutralBuyStrong buy
Summary
Neutral
SellBuy
Strong sellStrong buy
Strong sellSellNeutralBuyStrong buy
Moving Averages
Neutral
SellBuy
Strong sellStrong buy
Strong sellSellNeutralBuyStrong buy
Moving Averages
Neutral
SellBuy
Strong sellStrong buy
Strong sellSellNeutralBuyStrong buy
Displays a symbol's price movements over previous years to identify recurring trends.


