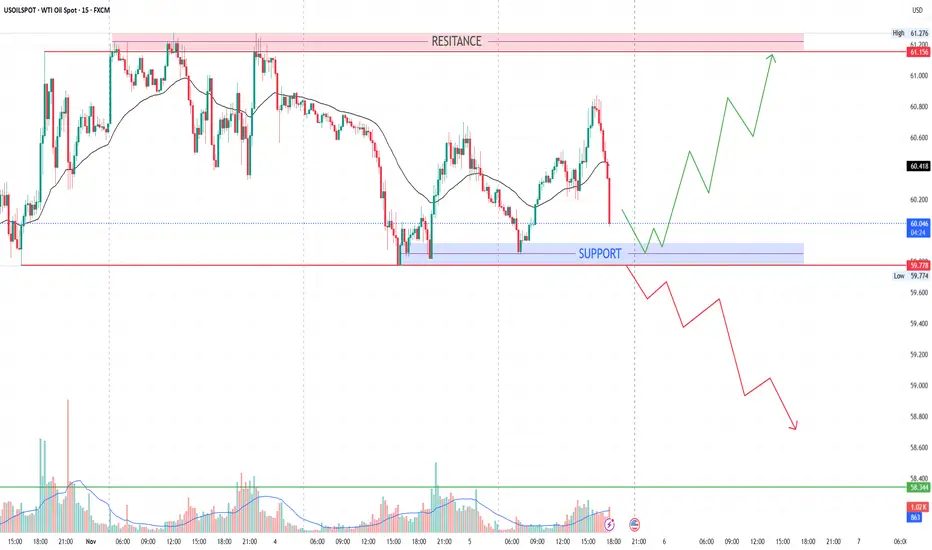
Today support & resistance for USOIL Here's a trading plan based on the provided USOILSPOT data:
**Trading Strategy**
* **Buy Entry:** Around 60.136 (as indicated in the "BUY" zone).
* **Sell Entry:** Around 60.096 (as indicated in the "SELL" zone).
* **Stop-Loss Placement:**
* For Buy Trades: Place your stop-loss slightly below the recent low (e.g., 60.080).
* For Sell Trades: Place your stop-loss slightly above the recent high (e.g., 60.140).
* **Target Price (Take Profit):**
* For Buy Trades: Consider a target around potential resistance levels (you'll need to analyze the chart for this).
* For Sell Trades: Consider a target around potential support levels (again, chart analysis is key).
**Important Considerations:**
* **Risk Management:** Always use stop-loss orders to limit potential losses. Adjust stop-loss and target levels based on your risk tolerance and the specific market conditions.
* **Chart Analysis:** This is a basic suggestion. Thoroughly analyze the USOILSPOT chart using different timeframes, technical indicators (moving averages, RSI, etc.), and patterns to confirm entries and exits.
* **News and Events:** Be aware of any relevant news, economic releases, or geopolitical events that could impact the price of oil.
* **Position Sizing:** Determine your position size based on your risk tolerance and account balance. Never risk more than you can afford to lose.
* **Disclaimer:** Trading involves risk. This is not financial advice. Always do your own research and consult with a financial advisor if needed.
Trade ideas
US OIL SUPPORT, RESISTANCE & TRENDLINE ANALYSIS Hello guyz hope uall r doing well. I am on a travelling spree so I apologize for not providing consistent updates.
Just trade along with the given levels provided. Do not be over greedy. Exit your trade each time it touches a level and book your profits. Don't loose your capital.
I shall provide more sharp and accurate updates when I will be home.
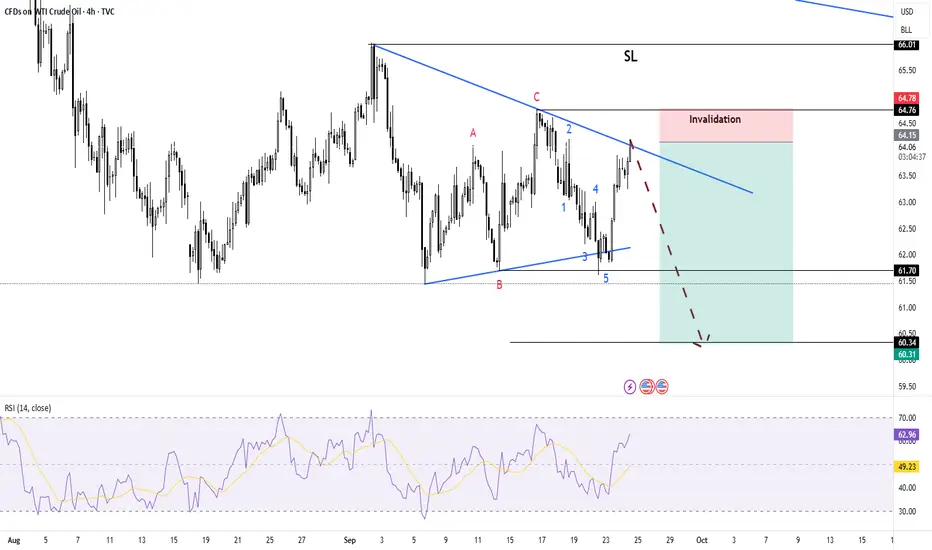
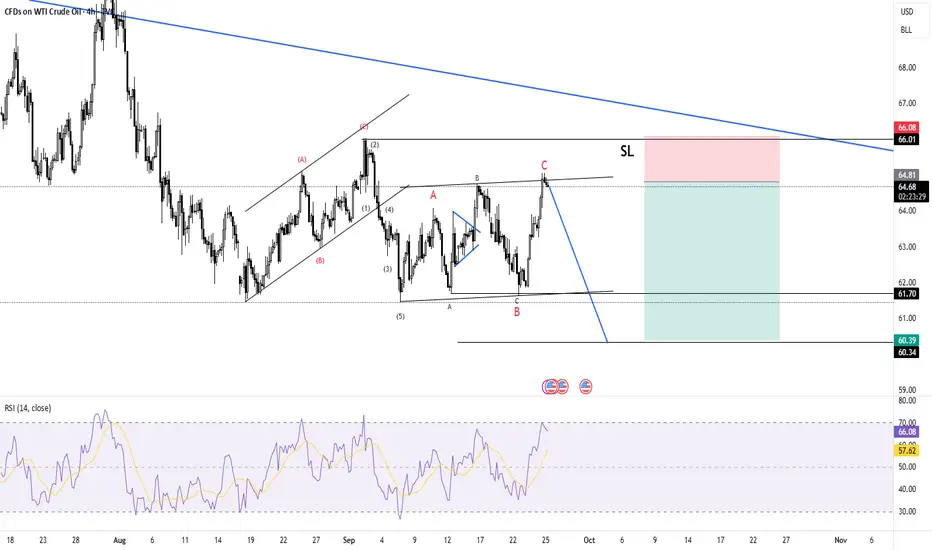
USOIL / CRUDEOIL Headed towards 65 USD?TF: 15 minutes
CMP: 60.20
After a one way parabolic move from the lows of 55.96 to 62.59, price went in to consolidation/correction mode.
The correction phase followed a simple zig zag (ABC) and it seem to have ended at 59.76 (We need to break above 60.78 and 62.04 for confirmation)
The internal counts are marked in the chart itself.
I believe that one more swing up is due and the ideal follow up swing / AB=CD pattern is as follows..
You could observe that same set up being printed on the down-move.. and now it is time for the mirrored up-move
Let's see how the price action unfolds in the coming sessions.
Worst case scenario, we could be testing 59 odd levels, but, I wouldn't be shorting at these levels anyways..
Disclaimer: I am not a SEBI registered Analyst and this is not a trading advise. Views are personal and for educational purpose only. Please consult your Financial Advisor for any investment decisions. Please consider my views only to get a different perspective (FOR or AGAINST your views). Please don't trade FNO based on my views. If you like my analysis and learnt something from it, please give a BOOST. Feel free to express your thoughts and questions in the comments section.

XTIUSD - Analysis
Trends:
* Weekly: Strong bearish structure — lower highs from 84–86; price now inside 59–57 support area.
* Daily: Bearish continuation within 66 → 57 range; momentum still down.
* 4H/1H: Rejected from 61.0–61.3 resistance; structure confirms fresh downside move.
*LSupport & Resistance:
* *Resistance:* 60.55–60.65 → 61.00–61.30
* *Support:* 60.00–59.80 → 59.20–58.80 → 57.20–56.80
Insights:
* Sell 60.55–60.65 after bearish 5M candle → SL 60.90 → TP1 60.00 → TP2 59.30 → TP3 57.20.
* If deeper pullback, short 61.00–61.30 → SL 61.55 → same targets.
* Invalidation: 4H close above 61.30 or daily close above 62.00.
* Expect continuation during US session (7–10 PM IST).

XTIUSD (Crude Oil) Technical View
Trend Check
• Weekly range persists; sellers near 66–67, buyers near 56–58
• Daily momentum turning lower after failing at 62–63
• 4H/1H lower highs show short-term bearish control
Key Levels
• Resistance: 61.5–61.8, 62.5, 63.0
• Support: 60.0–59.8, 59.0–58.8, 57.2–56.5
• Pivot: 61.0
Trade Ideas
• Sell rallies into 61.3–61.8 if rejection appears
→ Targets: 60.0, 59.0
• Staying below 61 keeps pressure toward 58s
• Above 62.2 opens room to 63–63.5 (no shorts there)
Notes
• Confirm entries with rejection candles
• Stops above resistance, take profits at support

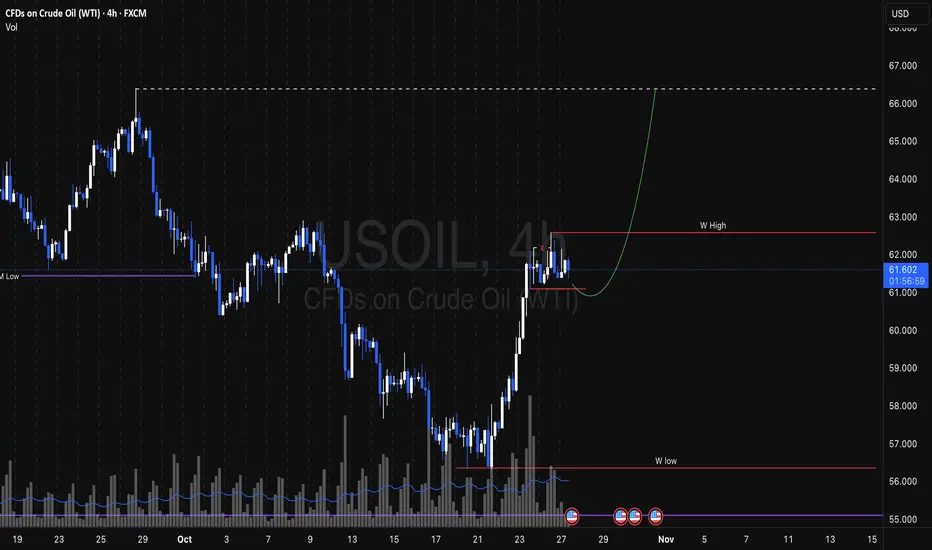
US OILUS Oil weekly was bullish. We can expect this week as bullish expansion. Hence giving US monthly with strong rejection from bottom and closing above monthly open price.
Wti analysis
(WTI) crude oil prices have demonstrated a strong upward trajectory, maintaining a significant bullish structure following the recent breakout from the $59.000 zone. The metal is currently consolidating just below the $62.000 level, with buyers stepping in to sustain momentum after the sharp rally. The $61.030 and $60.333 zones continue to provide strong support, reinforcing the current uptrend.
Outlook
• On the Upside : If WTI successfully breaks and sustains above the $62.000 resistance area, a move toward the multi-session high and key target of $63.671 appears increasingly likely. A decisive breakout above $63.671 could further extend gains, targeting higher resistance levels.
• On the Downside : If prices retreat, $61.030 will act as immediate support, with $60.333 and the strong psychological level of $59.000 serving as key levels to watch. A break below the $59.000 zone could trigger significant downside pressure.
Trend
The short-term trend remains strongly bullish, with WTI maintaining high consolidation levels and eyeing the $63.671 resistance mark. Market sentiment will be influenced by global inventory data and geopolitical supply developments.
Strategy
Buying on dips near $61.030 and $60.333 could provide opportunities, with stops placed below the $59.000 support. A decisive breakout above the $62.000 level would confirm further upside potential toward $63.671.
*Key Levels*
Resistance (R2) $63.671
Resistance (R1) $62.000
Support (S1) $61.030
Support (S2) $60.333

USOIL shortUs oil is in downtrend on hourly time frame. The price is at a key level at 200 ema hourly. Good short opportunity. Tp1 and tp2 are marked
USOIL A good opportunity for long in USOIL inverse head and shoulders at 4h time frame looking forward for good targets next week. Let's see how it goes

US OIL SUPPORT, RESISTANCE & TRENDLINE ANALYSISI hope whosoever followed my levels should have captured some good moves.
My levels shall remain the same as posted on my previous post.

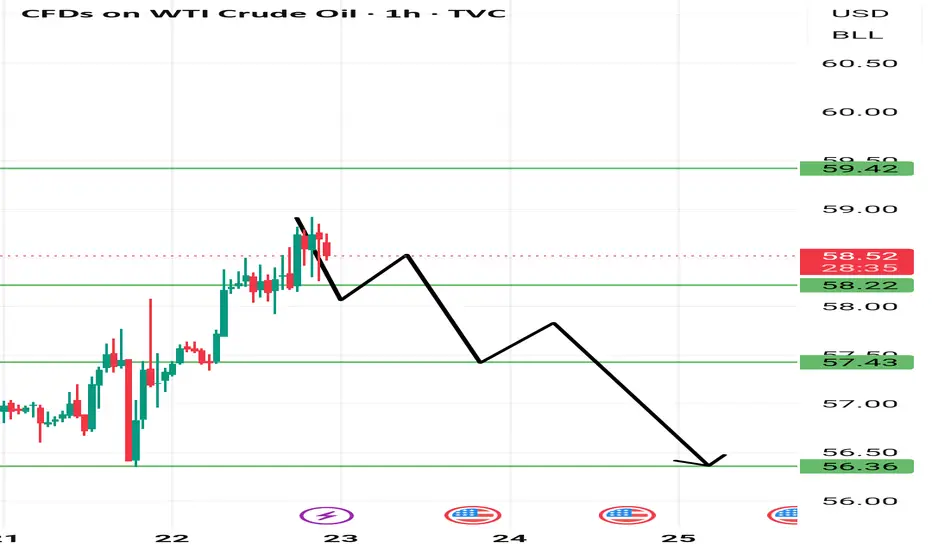
USOIL - BUY TRADE SETUPUSOIL – Short-Term Buy Opportunity ⛽️📈
After a significant sell-off, USOIL is showing signs of short-term bullish momentum. Traders can look for a retracement move, potentially triggered by a liquidity sweep around key levels.
Trade Idea:
Position: Buy (Short-Term)
Stop Loss: 56.30
Strategy: Given the recent sell-off, a small retracement bounce is likely. This move is ideal for traders willing to take slightly higher risk with smaller position sizing.
Why This Trade?
Recent liquidation zones suggest buyers may step in.
Strong potential for a retracement move before the next directional trend resumes.
Perfect for short-term traders seeking quick upside with controlled risk.
⚠️ Risk Disclaimer: Trade carefully. This setup involves risk due to recent volatility. Small quantity is recommended.
Trading Tip:
Look for confirmation via candlestick patterns before entering. Align with intraday sessions for higher probability entries.
USOIL Bullish Wolf Wave Pattern – Explained and Trade PlanThis 1-hour chart of WTI Crude Oil (USOIL) visualizes a classic bullish Wolf Wave pattern. Wave points 1, 3, and 5 form the lower channel, while points 2 and 4 set the upper boundary. Point 5 exhibits a typical overshoot below the 1-3 trendline, confirming a reversal zone. Entry is taken at 57 after confirmation, with stop loss at 56 placed below the recent swing low. Target is projected at 61.26, aligning with the extended 1-4 trendline—this matches classic Wolf Wave target methods. RSI divergence at point 5 further confirms the bullish reversal. This setup provides a high probability trade with clear risk management. Community feedback and alternate views are welcome.

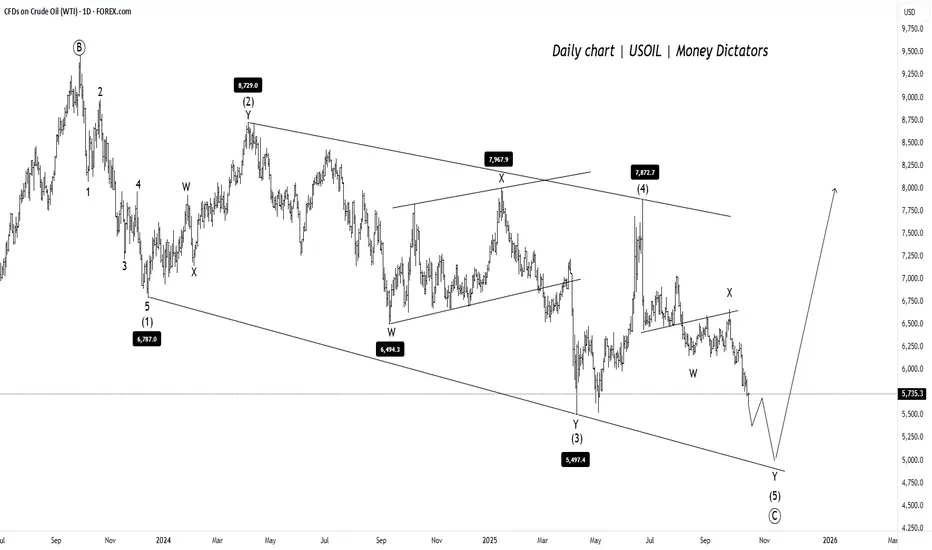
USOIL Near Final Leg USOIL is forming a clear corrective pattern inside a falling channel. Price is currently in the final leg of wave (5) of (C), suggesting one more dip is likely before reversal.
The downside target lies near 5,000–5,200 , where support from the channel base aligns. Once this level holds, a strong bullish reversal is expected, marking the end of the correction and the start of a new upward trend.
Stay Tuned!
@Money_Dictators :)
Crude Oil (WTI) Technical Analysis - October 17, 2025Current Price and OverviewAs
WTI Crude Oil is trading at 56.88 USD, down 0.58 (-1.01%) on the day. The market remains firmly in a bearish trend, with prices continuing to decline amid broader impulse wave C within a multi-month downtrend that began in July. Recent trading saw a brief rebound after testing support near 56.35, providing some positive momentum and easing oversold conditions, but the overall short-term outlook stays bearish. A bearish gap has formed below the key psychological level of 60.00, accelerating the downside.The technical summary across major indicators points to a Strong Sell, with no buy signals from moving averages and MACD confirming downward pressure.
Support and Resistance LevelsKey
Support Levels: 56.35 (immediate, recently tested), 49.5. (next major, deeper target zone 27 - 15 ).
Key Resistance Levels: 57.60–60.50 (Gold Zone, recent breakdown),
65.00 (major overhead resistance,
Price Action and Scenarios
Bearish Scenario (Primary): Prices have broken key support at 57.35 and the down-channel trendline, confirming continuation of wave C. Expect further downside to 55.20, with potential extension to 49.83 if momentum builds. Short positions are favoured on rebounds to resistance
Bullish Scenario ( Still Not Confirmed)
This analysis is based on hourly and daily charts; always consider fundamental factors like OPEC decisions or US inventory reports for confirmation.
Disclaimer
High Risk Investment
Trading or investing in assets like crypto, equity, or commodities carries high risk and may not suit all investors.
Analysis on this channel uses recent technical data and market sentiment from web sources for informational and educational purposes only, not financial advice. Trading involves high risks, and past performance does not guarantee future results. Always conduct your own research or consult a SEBI-registered advisor before investing or trading.
This channel, Render With Me, is not responsible for any financial loss arising directly or indirectly from using or relying on this information.

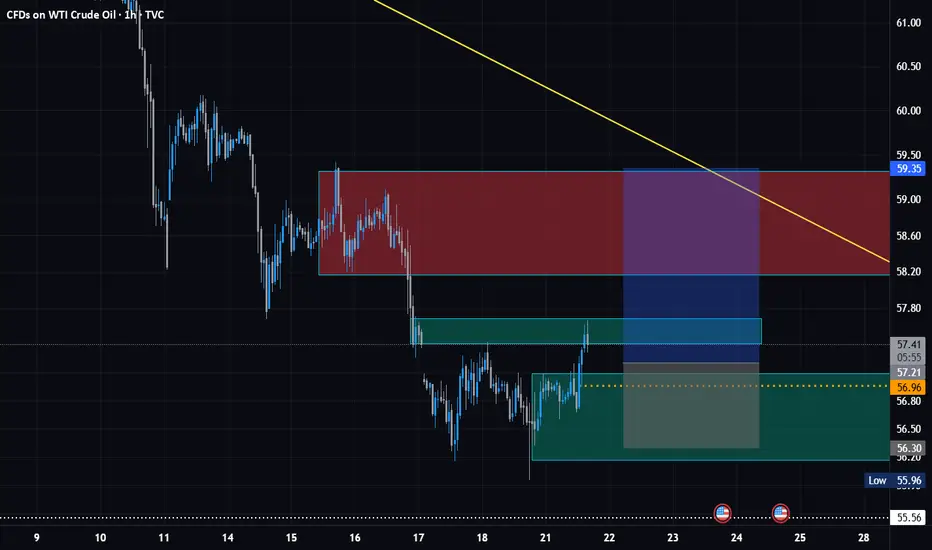
WTI Crude Oil – Dual Falling Wedges in Play!🛢️ #WTICrudeOil
CMP: $58.25
🟡 S maller Falling Wedge (Yellow)
• Breakdown candle formed
• Breakdown confirmation on weekly close below $58.22 (low of breakdown candle)
• Target: $52.71
• Converges with key price action support zone at $52.48–50.55
• Also aligns with long-term wedge trendline support
🟣 Larger Falling Wedge (Purple)
• Still intact
• Bullish Breakout confirmation: Weekly close above $77.57
🔽 Support Levels
• Immediate: $55.15
• Zones: $52.48–50.55, $45.04–42.93
🔼 Resistance Levels
• Immediate: $58.35
• Zones: $60.68, $61.45–61.96, $63.98–66.42
⚠️ Outlook
Short-term bias remains bearish , watching for a weekly close below $58.22 to confirm breakdown.
Long-term bullish reversal possible only above $77.57 (WCB) .
#CrudeOil | #WTI | #OilChart | #ChartPatterns | #FallingWedge | #PriceAction | #Commodities
📌 Disclaimer: This analysis is shared for educational purposes only. It is not a buy/sell recommendation. Please do your own research before making any trading decisions.

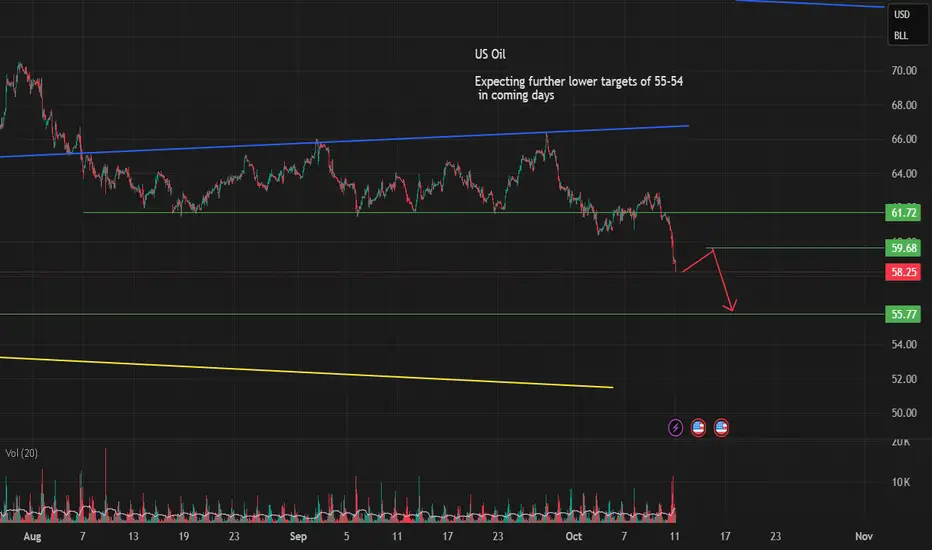
US Oil Expecting further lower targets of 55-54 in coming daysUS Oil
Expecting further lower targets of 55-54
in coming days
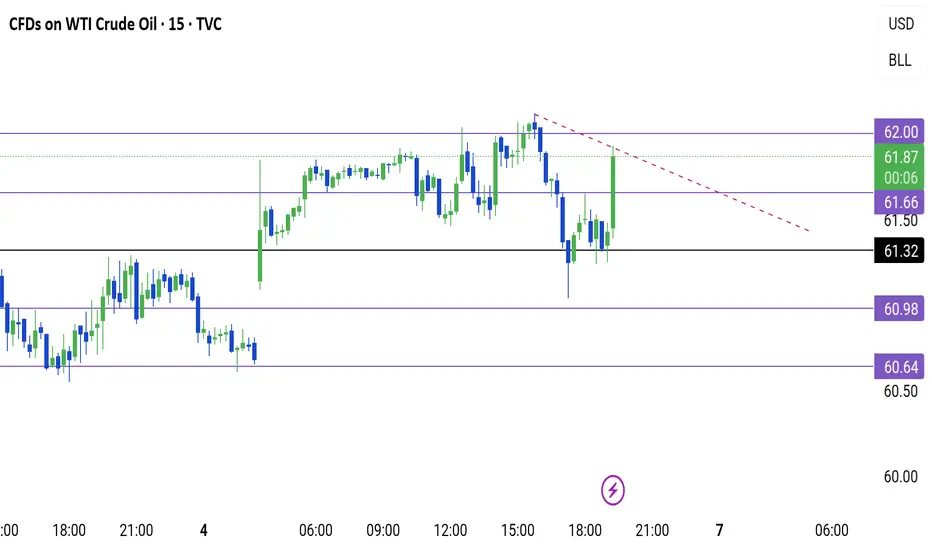
USOIL SUPPORT & RESISTANCE & TRENDLINEResistance at 61.66 and 62. If it breaks the said levels go for LONG.
For SHORT let it break 61.32 next at 60.98 and next at 60.64 if it breaks the last mentioned level it then a nice target downside.
If it breaks the trendline and sustains the plan for LONG.
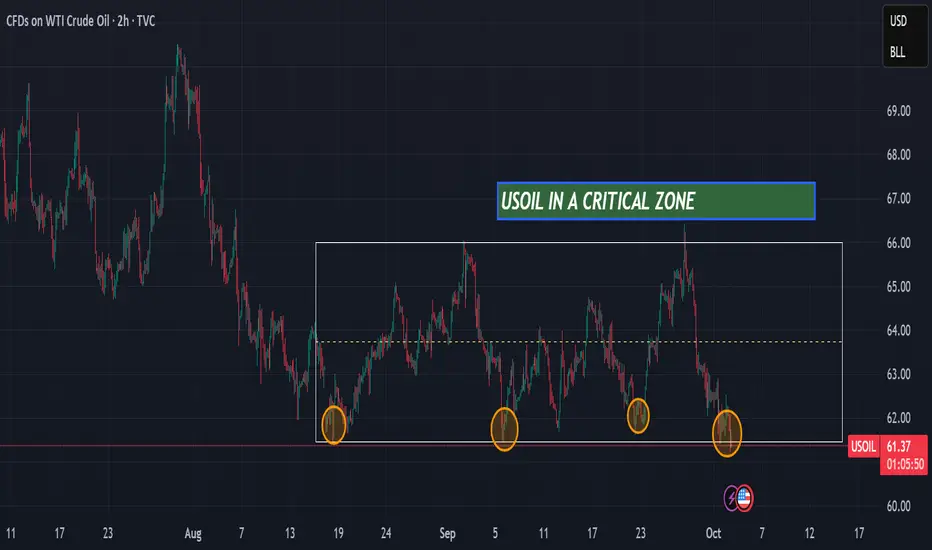
USOIL is in a critical zoneHello,
USOIL is currently at a major support level that has held for the past 2 months. There are two possible scenarios: either the support holds and USOIL bounces back toward the resistance at $66, or the support breaks and the price moves down to the next level at $60,
Ibrouri Abdessamad
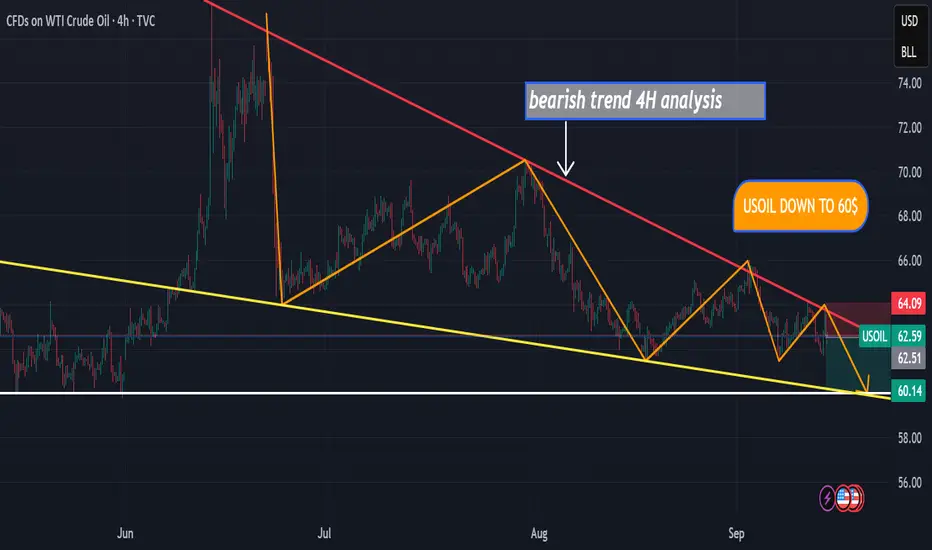
USOIL DOWN TO 60$hello,
I hope you’re doing well. I’ve identified a high-probability short setup on USOIL in the 4H timeframe. The chart is showing a clear downtrend, and based on the current momentum, I expect USOIL to reach the $60 level in the coming days
IBROURI Abdessamad
Buy UsOil Again as previously discussed my long position with low SL we will see this is a big trade and low risk trade

Looks like USOIL Crude has just started risingLooks like USOIL Crude has just started rising with SL near 60 / 62.
USOIL short setupI see the good risk/reward ratio sell setup in USoil as elliot wave analysis. elliot wave analysis is very complex analysis method and it aways have alternate count, how ever i shorting USOIl as it gives good risk/reward ratio.
US OIL ready to shortI sse USOil with good R/R setup. Impulse down at day TF and abc upward and again impulse downward.