S&P 500 Crash report BEAR MARKET PHASE. Alert !!!!!!Hiii
i am trader kanishk
if you are an investor please don't invest at this level.
watch this full video
this is a crashing market ahead
take it seriously.
Trade ideas

S&P 500 NEXT WEEK ENTRY POINTSS&P 500 NEXT WEEK ENTRY POINTS GIVEN FOR SHORT AND LONG POSITIONS. POSSIBLE SHORT POSITION FOR NEXT WHOLE WEEK. I AM USING SIMPLE AND EFFECTIVE SWING METHODS.COMMENT BELOW IF YOU HAVE ANY DOUBT OR SUGGESTION.

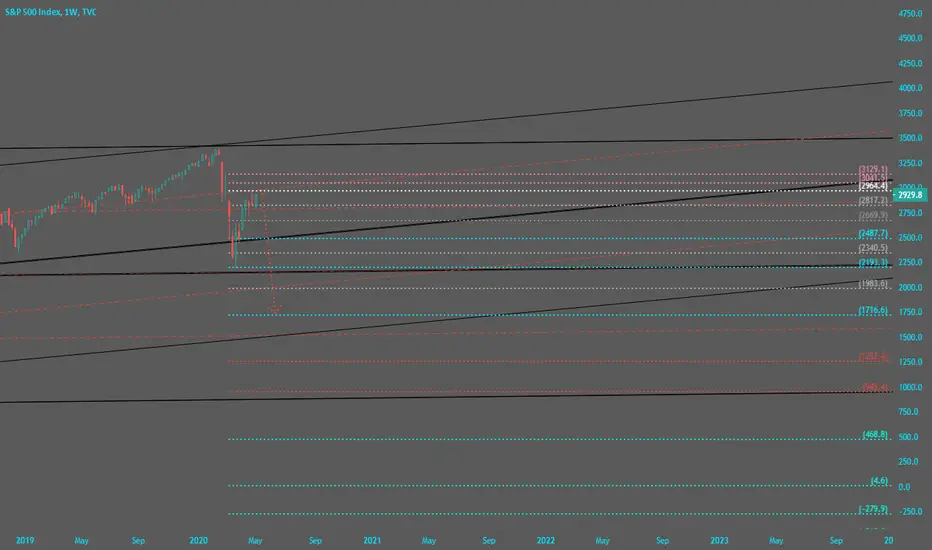
Elliot wave -- S&P 500Technically S&P 500 has formed Elliot wave pattern.According to Elliot wave pattern ..Currently Correction Wave 'C' is in progress...So I expect price would drag down towards 2700 to 2650 levels once it breaks below the 2930 levels on daily closing basis ...

Retracted from Island Gap High but ..has neither given a follow through to Bearish Engulfing, nor negated it.


ES500 will finish its trip of growing, after that it will takeES500 will finish its trip of growing, after that it will take a small rest in order to decide continue or go back down

SP500 Index- Nifty / Stock-ITC/Hindalco/Auropharma- Weekly CheckDisclaimer
-----------------------------
All investments involve risk, and the past performance of a security, industry, sector, market, financial product, trading strategy, or individual’s trading does not guarantee future results or returns. Investors are fully responsible for any investment decisions they make. Such decisions should be based solely on an evaluation of their financial circumstances, investment objectives, risk tolerance, and liquidity needs.
-----------------------------
SP500 Index - A possible top close to 3200 levels - Reasons for Top or Halting close to 3200
Wave Y = 61.8% of Wave -W
Middle Line of Parallel Channel is close to 3200 levels
Support / Hero turning their roles into Resistance / Villain - Polarity Reversal Concept close to 3200 levels
Index- Nifty
Nifty May Halt with Double Top at 10175 / Below 10175 for 10050 / Below 10050 for 9950 / More below 9950
Stock -ITC
Sell Below below 200 (strictly) for 195-196 / Below 195 for 190 / Below 190 for 185-186
Stock - Hindalco
Selling below 150-151 (Strict Stops above 151) Target -148 / 145.50 / 143 / 138 / 130-132
Stock - Auropharma
Selling next below 721 for Target 700 & Below 700 for 650-660 zone

S&P 500 at critical Fib LevelIndex at critical fib level, any weakness here can start another sell off

S&P will drop to 2972 & 2900 levels soonerS&P will drop to 2972 & 2900 levels sooner..(ON or B4 3rd June)
2 Entry levels: 3043 & 3081..
Stoploss: 3091 on 1D closing basis...


S&P 500 recovers artificiallyS&P 500 recovers artificially, however it is very possible that it will end up falling.
I am not proud or happy, however this is my market vision for the world's most powerful index.


Análise S&P gráfico diário TVC:SPX
Índice com dois toques na retração 0,61 e voltando a testar a Fibo 50,00 encontra-se em zona de indefinição. Para tendência de alta precisa romper os 2.937,4 pontos e armar o pivot de alta. Fazendo este movimento ativo pode buscar alvos em 3.171 e depois 3.186.
Se o movimento for a perda da retração de 0,50 está armando um pivot de baixa com alvos na queda em 2.750,7 e 2.701,9. A queda do S&P de hoje foi potencializada após o discurso do presidente do FED Jerome Powell que disse na ameaça de uma crise duradoura, além de praticamente descartar a possibilidade de juros zero. Corrobora com a extensão da crise, o desemprego nos EUA. Hoje os economistas do Goldman Sachs revisaram suas projeções para perspectivas mais sombrias. Os analistas David Mericle e Ronnie Walker estimam uma taxa de desemprego 25%, sendo um acréscimo de 10% frente a previsão anterior.

Cup and Handle on SPX, target 3000SPX has formed a cup and handle pattern and can retest 2950-3100 zone.


Short sell This short sell will be same as its Previous leg move , it will be sharp and fast , Once this move is completed Consider the Grand cycle move of Wave 4 has completed
and One can look for next 1 decade move of Opportunity as Wave 5
Right Now look for short sell

S&P 500 daily chartif the price breaks the fibo levels 50% 2748 S&P will be for sale
Please support this idea with LIKE if you find it useful.
GOOD LUCK
