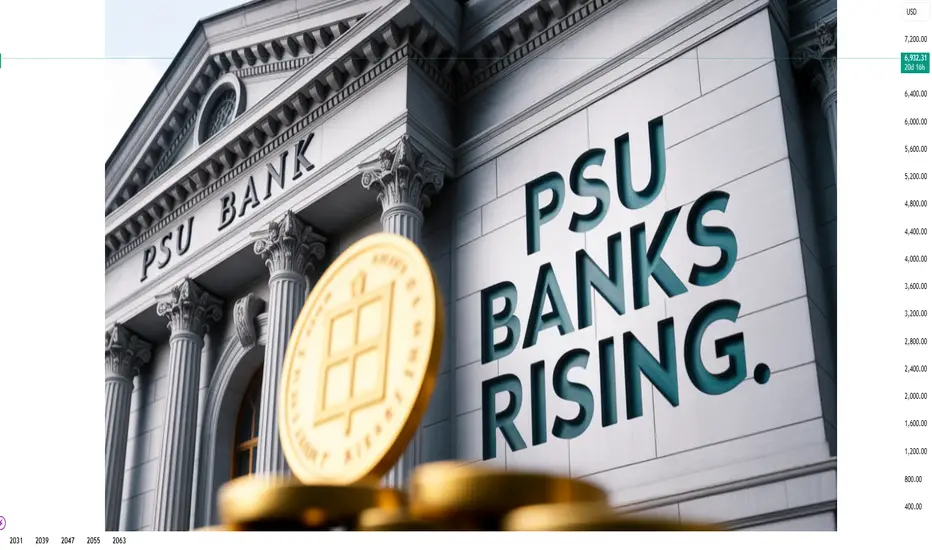
PSU Banks Rising: Understanding the Structural Turnaround1. Resolution of the NPA Crisis
The most important reason behind the rise of PSU banks is the significant improvement in asset quality. Between 2015 and 2019, PSU banks were hit hard by a surge in Non-Performing Assets (NPAs), mainly from stressed corporate loans in sectors such as infrastructure,
US S&P 500 Spot Index
No trades
The Modern Economic SystemImportance of Policymakers, Investors, and Traders
The global economic and financial system functions like a living organism, driven by decision-makers operating at different levels. Among the most influential actors are policymakers, investors, and traders. Each plays a distinct yet interconnected

#S&P📊 S&P 500 Wave Analysis Update
The S&P began its corrective phase on 29 Oct 2025, forming its A wave by 21 Nov 2025. From there, the index rallied into its B wave, retracing more than 61.8%, which signals the development of a flat correction.
Breaking down the B wave:
- The a wave formed on
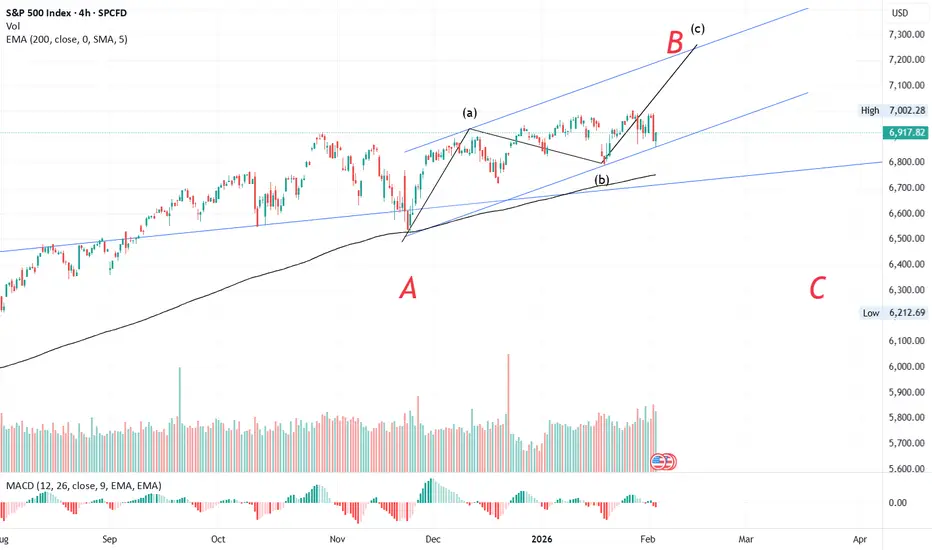
S&P 500 For Long Side viewS& P 500, 4 hrs time frame The Triangle ABCDE formation after A motive wave completion so next motive wave can be anticipate ....................

Open Interest (OI) Analysis for Futures & Options TradersOpen Interest Analysis for Futures & Options Traders
Open Interest (OI) is one of the most powerful yet misunderstood tools in the derivatives market. While price and volume tell traders what is happening, open interest helps explain why it is happening and who is likely behind the move. For future

Part 5 Best Trading Strategies Simple Example to Understand
Scenario
Nifty at 21500
You expect it to go to 21650.
Call Option Buy
Buy 21500 CE
If Nifty moves up → premium increases → profit
If Nifty falls → premium collapses → loss
Put Option Buy
Not useful in this scenario
Option Seller’s View
If seller expects market t

Part 2 Technical Analysis Vs. Institutional TradingHedging with Options
Options are powerful risk-management tools.
Portfolio hedging during market crashes.
Protect profits without exiting positions.
Institutional investors heavily rely on options for downside protection.
For example, buying index puts during uncertain periods can safeguard lon

How One Quant Giant Quietly Reshaped Global MarketsJane Street Impact
Jane Street is not a household name like Goldman Sachs or JPMorgan, yet its impact on modern financial markets is enormous. Founded in 2000, Jane Street is a quantitative trading firm and liquidity provider that operates across equities, ETFs, bonds, options, and cryptocurrencies

Momentum Patterns in Cryptocurrency MarketsUnderstanding Momentum in Crypto Markets
Momentum refers to the speed and strength of price movement in a particular direction. In crypto markets, momentum is driven by a combination of factors such as liquidity inflows, news events, social media hype, whale activity, derivatives positioning, and m

Part 1 Intraday Institutional Trading Types of Options- Call Option: Right to buy.
- Put Option: Right to sell.
Basic Strategies- Long Call: Bet on price ↑.
- Long Put: Bet on price ↓.
- Covered Call: Sell call on stock you own.
- Protective Put: Buy put on stock you own.

See all ideas
Displays a symbol's value movements over previous years to identify recurring trends.
Frequently Asked Questions
US S&P 500 Spot Index reached its highest quote on Jan 28, 2026 — 7,017.35 USD. See more data on the US S&P 500 Spot Index chart.
The lowest ever quote of US S&P 500 Spot Index is 666.79 USD. It was reached on May 31, 2007. See more data on the US S&P 500 Spot Index chart.
US S&P 500 Spot Index is just a number that lets you track performance of the instruments comprising the index, so you can't invest in it directly. But you can buy US S&P 500 Spot Index futures or funds or invest in its components.