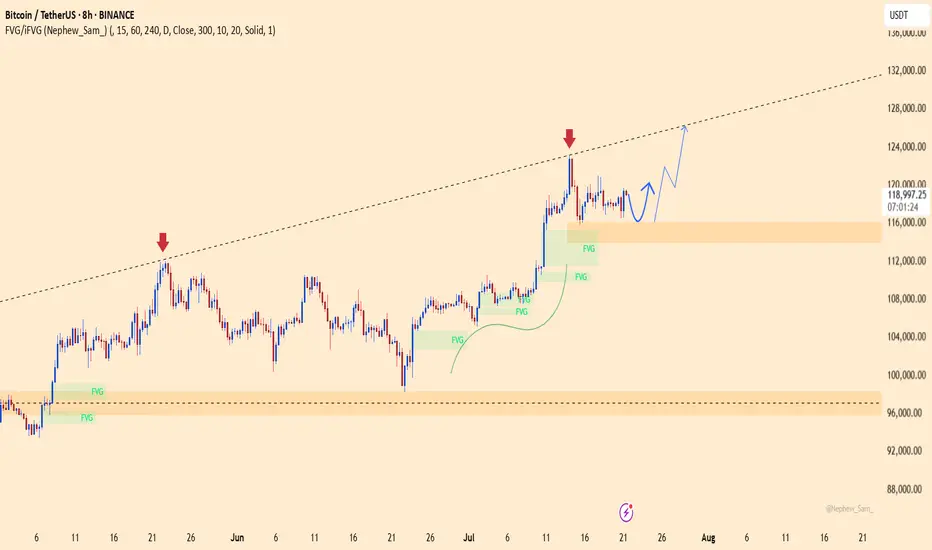
BTCUSDT – Rebounding from Fair Value Zone! Is the Bull Run Back?Bitcoin is building a strong base around the FVG support zone after rejecting the resistance trendline twice in a row. The current price structure is a textbook bullish setup: pullback – retest of liquidity zone – accumulation – and now prepping for a strong breakout.
Fair Value Gaps have been consistently filled and are acting as dynamic support, signaling that buyers are still in full control. RSI remains steady and not overheated – creating perfect conditions for a breakout.
Target: The 125,910 USDT area is the next clear price objective if BTC holds above the 116,082 USDT support zone.
Fundamental Catalyst: The crypto market is regaining strength after BlackRock officially confirmed its plan to expand its crypto ETF products – investor sentiment is back on the bullish side.
USTBTC trade ideas
BTC ChartBTC Chart "Lorem ipsum" is a placeholder text commonly used in graphic design, publishing, and web development. It is designed to mimic the appearance of real text without actually conveying any meaning. Its purpose is to allow designers to focus on the visual layout and presentation of a document without being distracted by the actual content.

BTC in 15TF...My Strategy...
If you want Ebook... DM me on IG - Trade_With_Shubham2006
📢 Just 99₹ & change your life forever...🧿🎯
$BTC – Bullish Pennant Formation
OKX:BTCUSD
#Bitcoin is currently consolidating inside a bullish pennant after a strong vertical rally from ~$98K to ~$123K 🚀
🔷 This pattern typically signals a continuation move — bulls are taking a breather before the next leg up.
📌 Key Levels:
🔹 Resistance: ~$120K–123K
🔹 Support: ~$116K
🔹 Breakout Target (on confirmation): $130K+
The price is like a spring ready to bounce! A big breakout with volume could send us soaring to new heights!
Don’t front-run it — watch for a clean breakout with strong candles and volume.
Eyes on the breakout! 📈

BTC 4 Hour Chart 🔍 Price Action Insight:
Bitcoin is currently consolidating within a symmetrical triangle on the 4H chart. This structure is forming after a strong bullish leg, indicating a potential continuation pattern.
📈 Breakout Levels to Watch:
Resistance to clear: 119,940 USDT
Immediate support: 117,280 USDT
Key support zones: 116,250 and 115,222 USDT

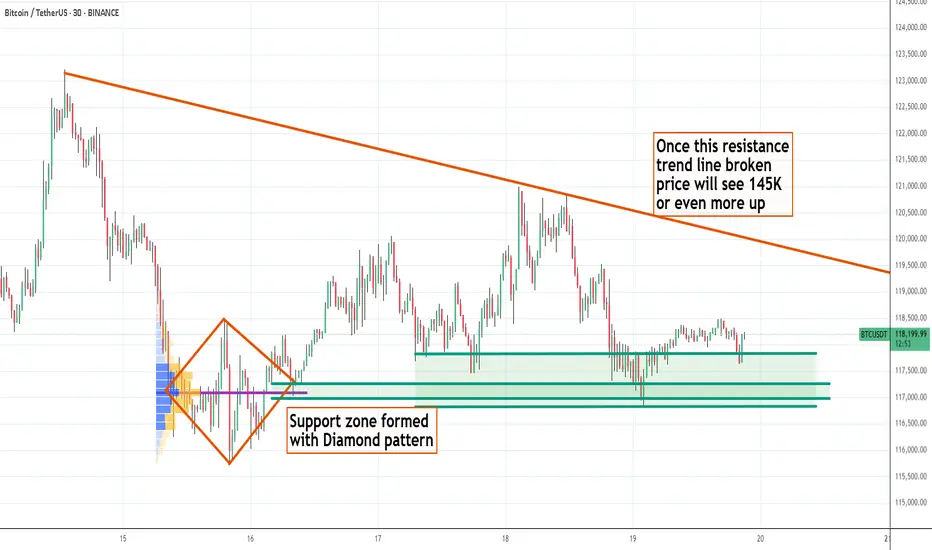
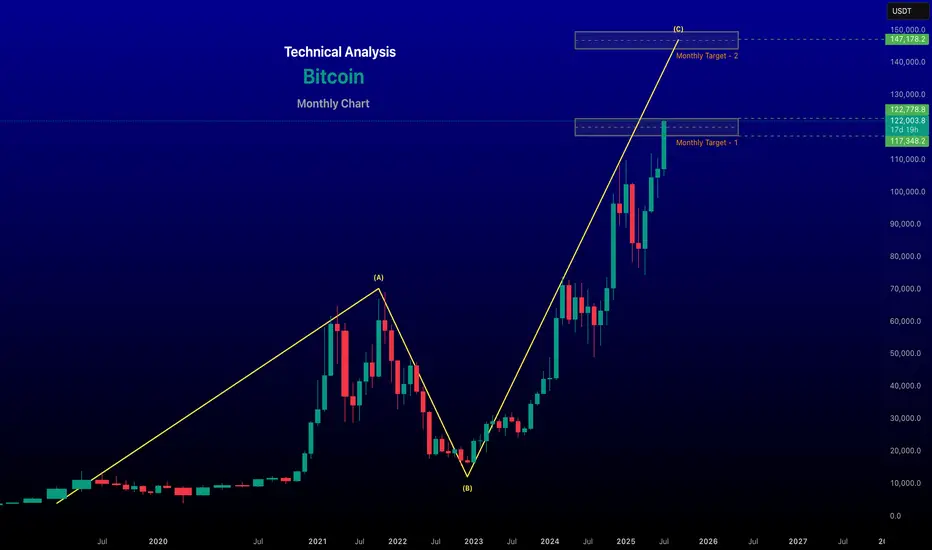
BTC - 19th July - Bullish with sideway correction - Target 145KBTC has been bullish with fundamental reasons - Fiat US $, US Govt Crypto Policy and non stop accumulation by Saylor and ETF, corporates etc ... every week and month new corporates adapting BTC After a good move price is now seeing side way correction and once the newly formed resistance line taken, I strongly expect BTC price to see 145 K easily
BTC AI Prediction Dashboard - 6h Price Path (19.07.25)
Prediction made using Crypticorn AI Prediction Dashboard
Link in bio
BTCUSDT Forecast:
Crypticorn AI Prediction Dashboard Projects 6h Price Path (Forward-Only)
Forecast timestamp: ~14:30 UTC
Timeframe: 15m
Prediction horizon: 6 hours
Model output:
Central estimate (blue line): -118,036
Represents the AI’s best estimate of BTC’s near-term price direction.
80% confidence band (light blue): 117,507 – 118,220
The light blue zone marks the 80% confidence range — the most likely area for price to close
40% confidence band (dark blue): 116,886 – 119,191
The dark blue zone shows the narrower 40% confidence range, where price is expected to stay with higher concentration
Volume on signal bar: 197.06
This chart shows a short-term Bitcoin price forecast using AI-generated confidence zones.
Candlesticks reflect actual BTC/USDT price action in 15-minute intervals.
This helps visualize expected volatility and potential price zones in the short term.
BTCUSDT BTCUSDT has given all time high of 1,23,200$ and now consolidate at 1,19,000 price but as we can see it's forming bearish flag pattern with target of 1,13,900$ , However we also gave CME gap at the same price (1,13,900$). After filling CME gap we can see further upside move towards 1,50,000$.

BTCUSDT – Breakout confirmed, bullish momentum continuesBTCUSDT has officially broken above a long-standing resistance channel, confirming a breakout and establishing a base around the nearest Fair Value Gap. The price action maintains a clear uptrend structure with consecutive higher lows and higher highs, supported by consistent buying pressure after minor pullbacks.
In terms of news, the U.S. decision to temporarily delay stricter regulations on spot Bitcoin ETFs, along with stable interest rate signals from the Fed, has boosted market sentiment. Capital continues to flow into crypto, especially as altcoins show limited recovery, making BTC the preferred asset.
As long as BTCUSDT holds above the nearest support zone, the pair is likely to advance toward the next psychological resistance. Any pullbacks could offer a buy-on-dip opportunity in line with the current trend.

BTCUSDT: Strong Uptrend, Targeting New HighsBTCUSDT is in a very strong uptrend, consistently setting new highs driven by overwhelming buying pressure and green Fair Value Gaps (FVGs).
Currently at $125,144, Bitcoin could reach $134,128 around July 21, 2025. This rally is fueled by ETF approvals, the Halving effect, a favorable macroeconomic environment (safe-haven, inflation hedge), and the expanding crypto ecosystem.
The preferred strategy is to buy on dips or breakout of resistance, always managing risk tightly.

Bitcoin shows bearish Divergence on weekly time frameBitcoin is showing bearish Divergence on weekly time frame along with the resistance drawn from 2018 & 2021 highs. Ignore the moonbois calling 200k-400k. Music is about to stop.
Disclaimer: DYOR, NFA

renderwithme | Bitcoin Technical Analysis for August 2025 # Price Trends: Bitcoin is trading above key exponential moving averages (EMAs) on daily charts (20-day: $108,285; 50-day: $105,843; 100-day: $101,952; 200-day: $95,985), signaling sustained bullish momentum.
# Support and Resistance:Support: $110,000–$111,909 is a critical support zone. A drop below could test $105,000 or $101,000.
# Resistance: $125,724–$126,000 is the next hurdle. A breakout above could target $145,000–$150,000
Chart for your reference
~~ Disclaimer --
This analysis is based on recent technical data and market sentiment from web sources. It is for informational \ educational purposes only and not financial advice. Trading involves high risks, and past performance does not guarantee future results. Always conduct your own research or consult a SEBI-registered advisor before trading.
#Boost and comment will be highly appreciated
Weekly Bitcoin (BTCUSDT) Outlook | Altcoin Season on the Horizon✅ BTC Hits a New All-Time High — Now What?
Bitcoin has just printed a new all-time high, which is often a critical time to watch the market closely, especially altcoins. We may be approaching the start of an altcoin party, and this is when attention to the broader crypto market pays off.
📈 Weekly BTC Chart Analysis
Looking at the weekly timeframe, BTC has been trading inside a rising channel. Historically, each time BTC has tested the bottom of the channel, it has rebounded and pushed to form new highs. Currently, we are interacting with the channel's midline, a key decision point.
📌 Several bullish signs are emerging:
RSI is approaching the 70 level, potentially signaling the start of a strong upward momentum.
The SMA cluster is tight and directly beneath the current price candle, which often precedes a sharp move.
That said, this does not mean it's time to jump in impulsively. Instead, we should wait for confirmation on lower timeframes (e.g., 4H or 1H) before entering long positions.
❌ As for short positions — there’s no compelling reason to go short right now. The market remains strongly bullish, and any downward move is more likely to be a temporary correction within an uptrend rather than a reversal.
📉 If price breaks through the midline sharply, keep a close eye on lower timeframes for bullish triggers to go long.
📊 BTC Dominance (BTC.D) Weekly Outlook
Take a look at the chart on the right — this is Bitcoin Dominance (BTC.D). Despite BTC making a new high, dominance has been declining, which is a bullish sign for altcoins.
While BTC.D hasn’t fully broken into a downtrend on the weekly chart just yet, a weekly candle close below 63.3% would confirm a bearish structure on BTC.D, increasing the odds of a strong altcoin rally.
⚠️ Risk Management Reminder
A rapidly moving market often leads to emotional decisions and FOMO-driven behavior. But this is exactly when risk control matters most.
Always follow a well-defined trading plan.
Prepare your strategy before the breakout, not after.
Position sizing and risk allocation must be deliberate — the brain reacts slower when price action gets wild.
🚀 Final Thought
This week’s setup is promising — Bitcoin is in price discovery, and altcoins are gaining momentum. With BTC.D potentially breaking down, a strong altcoin season could be forming.
Don’t rush in — let the charts confirm your setups on lower timeframes and stay disciplined.
#Bitcoin #BTCUSDT #BTCdominance #CryptoAnalysis #WeeklyCryptoOutlook #Altseason #AltcoinRally #PriceDiscovery #CryptoStrategy #TechnicalAnalysis #RiskManagement #FOMOControl

BTC AI Prediction Dashboard - 6h Price Path (12.07.25)
BTCUSDT Forecast:
Crypticorn AI Prediction Dashboard Projects 6h Price Path (Forward-Only)
Forecast timestamp: ~11:55 UTC
Timeframe: 15m
Prediction horizon: 6 hours
Model output:
Central estimate (blue line): ~118,048
40% confidence band (light blue): 117,958 – 118,517
80% confidence band (dark blue): 117,476 – 119,229
Volume on signal bar: 53.47
Observations:
Price currently near central estimate, within 40% band
Continuation likely as long as price remains within 80% band
Moves outside 80% = low-probability fade or potential breakout
Model does not repaint. Forecast is fixed once published.

Bitcoin (BTCUSDT) Breaks New ATH at $118K | What’s Next? Altseas🎉 Congratulations to all crypto enthusiasts — Bitcoin has officially printed a new all-time high at $118,000!
🔍 Now What?
On the right side of the chart, you can see Bitcoin's daily structure. If you’ve been following along, you’ll recall that BTC was trading within a descending channel. But now, we've decisively broken through the upper boundary of that channel, which is a bullish signal.
📌 Based on classic technical analysis, when a descending channel breaks upward, the next target is often the opposite side of the origin point — meaning BTC has potential to push toward $130,000 in the coming weeks.
🚨 Caution: Don’t Fall for FOMO
The market is clearly in a hype-driven phase, and while there are plenty of opportunities for new entries, especially in altcoins, risk management is key.
💡 Here's what you should do:
Avoid chasing pumps blindly.
Position sizing matters more than ever.
Stay alert, but don't be afraid to take small calculated long positions.
📈 Smarter Long Entries on Lower Timeframes
Watch for small consolidations or a retest near the daily breakout candle. On the 4H and 1H timeframes, clean setups will form that allow you to enter long positions with tighter stops.
Everything is now clearly bullish. Momentum is in favor of buyers.
📊 BTC Dominance (BTC.D) Breakdown = Altcoin Signal
On the right side of the second chart, we’re monitoring BTC Dominance (BTC.D) — which has been dropping while BTC continues to climb. This is a very bullish sign for altcoins.
🔁 What we want to see now:
BTC.D starts to range or correct slightly.
Ideally, this would happen while BTCUSDT stabilizes or continues its rally.
This scenario could trigger an altcoin rally, or potentially a full-on altseason.
✅ Final Thought
Momentum is clearly with the bulls. BTC has broken into price discovery, and altcoins are waking up. Don’t fear the market, but control your risk and look for smart entries — the altseason may have just begun.
#Bitcoin #BTCUSDT #CryptoAnalysis #ATH #Altseason #Altcoins #TechnicalAnalysis #BTCdominance #BreakoutTrading #CryptoMarket #CryptoStrategy #PriceDiscovery #RiskManagement

Renderwithme | Bitcoin at resistance Bitcoin Price Analysis for Next Week (July 14–20, 2025)Predicting Bitcoin's price for the
upcoming week involves analyzing current market trends, technical indicators, and macroeconomic factors. Based on recent data, here’s a concise analysis for Bitcoin (BTC) for the week of July 14–20, 2025. Note that cryptocurrency markets are highly volatile, and predictions are speculative. Always conduct your own research before making investment decisions.Current Market OverviewCurrent Price: As of July 7, 2025, Bitcoin is trading around $108,000–$109,420.41, with slight variations across sources.
Recent Performance: Bitcoin has shown a modest upward trend, with a 0.56% increase over the past week and a 4.38% gain over the last month. It reached an all-time high of $112,000 on May 22, 2025, but recently pulled back from $110,000 due to whale transfers and macroeconomic uncertainty.
Market Sentiment: Sentiment is cautiously optimistic, with the Fear & Greed Index in the Neutral zone, indicating investors are accumulating during dips. Technical indicators suggest a bullish outlook, though short-term volatility is expected.
Technical AnalysisPrice Levels and Trends:Bitcoin is trading above key support levels at $106,700 and $103,709 (20-day and 50-day EMAs), with resistance at $109,800–$112,000. A weekly close above $109,000 could confirm a breakout, potentially targeting $113,500 or higher.
A descending triangle pattern is noted, with a potential breakout by early August. If bullish momentum persists, $110,000 is a key resistance to watch. Failure to hold above $99,000 could lead to a retest of $94,000–$96,000.
Disclaimer --
This analysis is based on recent technical data and market sentiment from web sources. It is for informational purposes only and not financial advice. Trading involves high risks, and past performance does not guarantee future results. Always conduct your own research or consult a SEBI-registered advisor before trading.
#Boost and comment will be highly appreciated

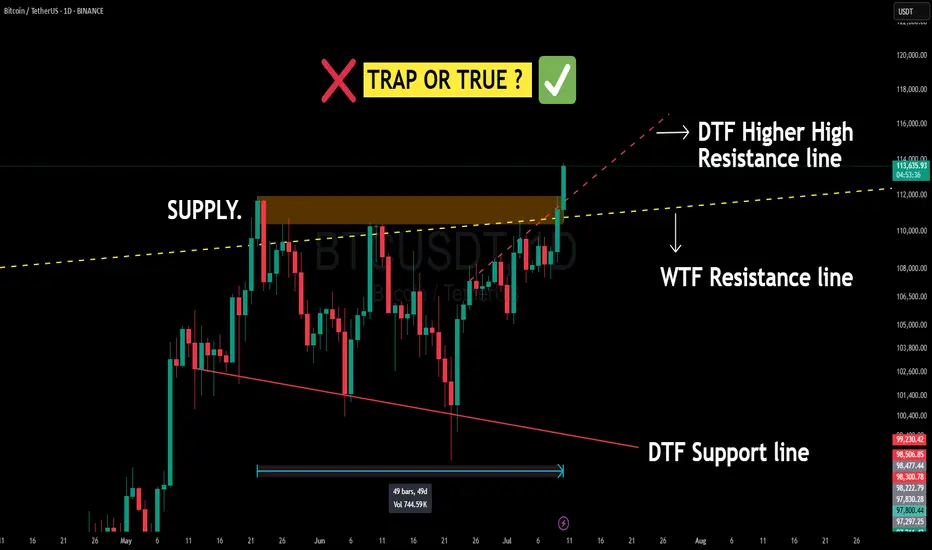
BITCOIN Just Smashed a 50-Day Supply Wall — Breakout or Fakeout Bitcoin (BTC/USDT) on the Daily & Weekly Timeframe just pulled off something BIG:
✅ Broke out of a 50-day consolidation range
✅ Closed above a strong Daily supply zone
✅ Cracked both DTF & WTF resistance lines (including a higher-high dynamic DTF resistance)
✅ Volume confirmation with a strong green candle
📌 This is an extremely bullish structure for short-term scalping ideas.
But Wait — What’s Happening Technically?
Supply Zone: This orange box is where BTC got sold off multiple times before. Breaking above this = strong bullish intent.
⚠️ Caution: Bitcoin is the King of Fakeouts 👑🐍
BTC has a notorious nature for false breakouts, trapping both bulls and bears. That’s why:
🧠 Best Strategy = Trap Trading OR
⏳ Wait for a pullback and retest of broken zones on higher timeframes . Plan your trade - trade your plan .
Don't chase — let price come to you.
💬 Drop your thoughts / doubts in comments.
📌 Not financial advice — just me and my Emotions
Bitcoin (BTCUSDT) Daily & 1H Analysis | Bullish Breakout ConfirWe’re seeing a strong move from Bitcoin today across both daily and lower timeframes. Let’s break it down:
🔍 Market Recap & Structure (Daily & 1H):
Bitcoin has made a decisive move upward with solid bullish volume. The size of the candles and their follow-through confirms a healthy push by buyers — exactly what we were anticipating.
As discussed in our previous analysis, we were biased toward long setups with higher risk allocation. That plan worked well: BTC broke above 109,107.29, triggering our early entry, and successfully closed the daily candle above the major resistance at 110,221.73.
This breakout signals a potential resumption of the primary bullish trend, and we could be entering a new High Wave Cycle (HWC) — a phase marked by directional momentum and strong inflows of capital.
Unless macro conditions shift dramatically (e.g. unexpected interest rate hikes), the path of least resistance is to the upside.
📈 Long Position Management:
If you're already in a long position from yesterday, my suggestion is to hold your position. However, if you opened multiple trades, it may be smart to close one and secure profits, while letting the others run.
Personally, I’m still holding my position open since many key altcoin levels haven’t broken yet, and further upside potential remains.
📌 New Entry Plan:
At this stage, entering with full size might not be ideal. It's better to:
Reduce risk per position
Wait for a new structure to form (higher low or small consolidation)
However, short-term aggressive traders can still look for low-risk re-entries on the 1H or 15-minute charts if BTC breaks above 111,713.12 — just make sure to manage your stop-loss tightly and keep the risk small.
📉 Short Positions?
I currently don’t favor short positions. The market structure is strong, volume on bullish candles is higher, and during the recent pullbacks, we’ve seen lower volume — a textbook sign of healthy correction.
We can now shift our strategy to Dow Theory-based trend trading, where we follow the sequence of higher highs and higher lows.
If needed, you can trail your stop-loss upward to lock in gains as the market structure builds further.
⏰ Final Thoughts:
The market still has room to move — don’t fall into FOMO. Start with smaller risk and scale into your positions. Protect your capital, follow the trend, and let the market confirm its next steps before going in heavy.
#Bitcoin #BTCUSDT #CryptoAnalysis #BTCBreakout #PriceAction #DayTrading
#TrendTrading #TechnicalAnalysis #CryptoMarket #HighWaveCycle #TradingSetup
#LongPosition #RiskManagement #DowTheory #MarketUpdate #BTCBullish
#CryptoTA #BreakoutStrategy #SmartMoney #AltcoinWatch #CryptoMomentum

BTCUSDT.P Bearish Setup – 30m ChartThis chart highlights a potential bearish reversal in Bitcoin (BTCUSD) on the 30-minute timeframe, observed on Binance’s perpetual contract.
Key Bearish Signals
• Dark Cloud Cover Pattern: A classic bearish candlestick pattern has formed, signaling a possible reversal from the recent uptrend.
• All-Time High Reaction: The price action reached a new high, suggesting a likely pullback or consolidation before any further upward momentum.
Trade Plan
• Entry: Trigger a short position on a confirmed break below the local structure.
• Stop Loss (SL): Place SL just above the candle structure to protect against false breakouts.
• Exit/Take Profit: Target the last major support/resistance level for profit-taking.
Notes
• Monitor for confirmation before entering the trade.
• Always manage risk according to your trading plan.
This setup is for educational purposes—trade responsibly!

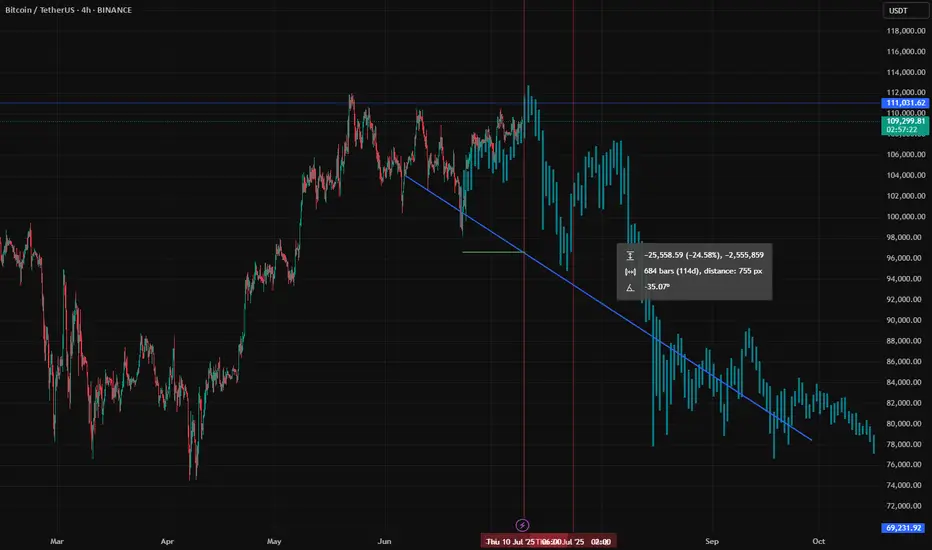
Probably not so high after allExamining the historical Bitcoin movement, it appears that Bitcoin will likely drop to the 100,000 - 105,000 level by the end of this month.
If the drop continues, we will see it drop to 80,000.
What is your opinion?
[SeoVereign] BITCOIN Bearish Outlook – July 9, 2025We are the SeoVereign Trading Team.
With sharp insight and precise analysis, we regularly share trading ideas on Bitcoin and other major assets—always guided by structure, sentiment, and momentum.
🔔 Follow us to never miss a market update.
🚀 Boosts provide strong motivation and drive to the SeoVereign team.
--------------------------------------------------------------------------------------------------------
Hello.
This is SeoVereign.
As of July 9, 2025, I present a bullish outlook on Bitcoin.
This idea is an extension of the analysis posted on July 6.
Therefore, it will be easier to understand this analysis if you first read the July 6 idea.
The position reached the second target price and then showed a downward movement.
In this idea, harmonic 0.382 and 1.618 patterns have been additionally identified, and accordingly, I plan to continue holding the long position entered from the July 6 entry point.
The average target price has been set around 109,150 KRW.
I will continue to track the situation, clarify the rationale, and provide updates through this post.
Wishing you continued good fortune.
Sincerely,
SeoVereign

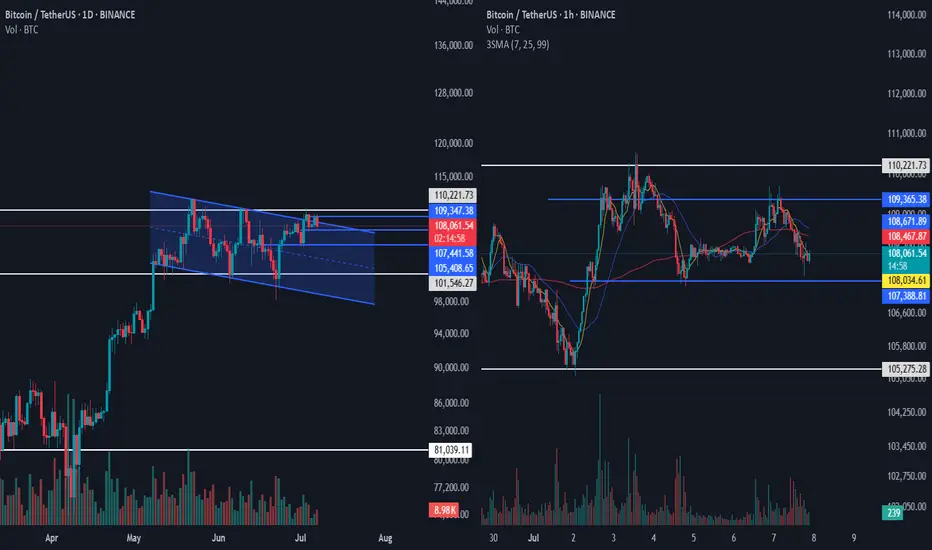
Bitcoin (BTCUSDT) Daily & 1H Analysis | Key Levels & Early EntryApologies for the late upload — it’s been a busy day, but let’s jump into the chart.
🔍 Market Overview (Daily):
Not much has changed since Monday. BTC had a minor drop accompanied by volume, but it’s difficult to judge that volume clearly, as it may simply reflect the first day of the weekly session. What we should focus on instead is where we currently are in the market — BTC is trading just below a critical resistance zone, which aligns with the previous all-time high.
The recent price structure is showing choppy and inconsistent candles, hinting at confusion and lack of direction. Because of this, we may need to consider early entries in BTC to avoid getting caught in sudden volatility when price approaches the 110,221.73 resistance again.
📌 Key Technical Insight:
We’re either dealing with a descending channel (not yet broken from above) or a wide consolidation range between 110,221.73 and 101,546.27. Unless BTC cleanly breaks above the range top, or fakes out and reverses, we may continue down to the mid-line or lower boundary of the structure.
For now, while the overall structure remains bullish, the current momentum is neutral to slightly bearish, and traders need to be tactical.
📈 Bullish Triggers:
Main Long Trigger: 110,221.73
A confirmed break above this resistance opens the door for a bullish continuation.
Early Long Trigger (1H chart): 109,365.38
Useful for early positioning, especially if accompanied by strong momentum.
📉 Bearish Triggers:
Daily Key Short Level: 105,408.65
If this level breaks with momentum, a short setup becomes valid.
1H Short Opportunity:
Watch for price action near 107,388.81. A failed swing or fake-out above this level could provide a short setup — ideally with a stop-loss just above the fakeout.
Another entry would be a clear lower high followed by a breakdown below 107,388.81, which could offer tighter risk and better R:R for short trades.
🎯 Execution Plan:
If BTC drops, I’ll wait for momentum to slow down and consolidation to form. As long as we remain above 105,275.28, I’ll look for opportunities to long with the market’s bullish bias — keeping risk low (0.25% per trade) until structure confirms direction. For now, the bulls are slightly stronger, so I personally lean toward long setups.
⏰ Final Note:
Stay flexible. The current range is messy, but smart entries can still provide solid trades. Be prepared, manage
#Bitcoin #BTCUSDT #CryptoAnalysis #PriceAction #DayTrading #BTCAnalysis
#TechnicalAnalysis #CryptoTrader #RangeTrading #BreakoutStrategy #RiskManagement
#TradingSetup #CryptoMarket #SwingTrading #MarketStructure #TradeSmart
#CryptoTA #Altcoins #TradingPlan #VolumeAnalysis #ChartPatterns
BTC/USDT 4H Analysis – Key Supply Zone Holding Strong📊 BTC/USDT 4H Analysis – Key Supply Zone Holding Strong 🟥🟩
🚀 Chart Summary (July 7, 2025):
The BTC/USDT 4-hour chart reveals a clear range-bound market between strong support and resistance levels, with price currently consolidating inside a crucial supply zone.
🔍 Key Technical Highlights:
📌 Supply Zone (Resistance) – $109,500 to $110,800
🔴 Multiple rejections from this area (highlighted with red arrows) show that sellers are active and defending this zone aggressively.
🟡 Next major resistance target: $114,230.34 if breakout occurs.
📌 Demand Zone (Support) – $104,000 to $105,500
🟢 Seen several strong bounces here, indicating buyers stepping in confidently.
💪 Price has tested this support multiple times (green arrows) and maintained strength.
⚖️ Current Price Behavior:
📉 Price is once again pulling back after testing the supply zone.
This could either be:
A potential short-term retracement within the range
Or a build-up before a bullish breakout toward $114K 🎯
🧠 Conclusion & Outlook:
🔄 BTC is still range-bound, with no confirmed breakout.
🔺 Bullish Scenario: Break and close above $110,800 → possible rally to $114,230+.
🔻 Bearish Scenario: Drop below $104,000 → could retest $100K psychological level.
📌 Strategy Tip: Wait for breakout confirmation before entering major positions. Range traders may continue to play between the zones.
📈 Stay patient, follow structure, and manage risk carefully! 🧠💼
