<VIRTUAL> – H1/H4/D1 Map | Key Levels, OI/Funding Context*Thesis (1–6 weeks):** Tactical map for . I use H1/H4 for execution, D1 for structure. Only trade when price + OI/funding confirm.
**Setup:**
– Structure: .
– Key support: , .
– Key resistance: , .
– Momentum trigger: H4 close > with rising volume.
**Derivatives checks (context, not signals):**
– OI(24h):
– Funding:
– L/S skew:
**Plan:**
– Spot adds: .
– Leverage (max 3–5x): Only on breakout > with OI ≥ +3% and funding ≤ +0.01.
– Invalidation: Daily close < or H1 structure break (last HL/LL).
**Risk:**
– Cut 30–50% if funding > +0.012% or OI stalls for 4h.
– Hard stop 2× ATR(H1) from entry; per-trade risk ≤ 0.5–1.0% of portfolio.
*Not financial advice. For my log: I update levels if structure changes.*
VIRTUALUSDT.P trade ideas
VIRTUALDiscover your next crypto opportunity on TradingView. Our platform provides comprehensive charts, real-time market data, and powerful analytical tools for a vast array of cryptocurrencies. Explore a vibrant community of traders, share insights, and track coin performance with custom indicators and watchlists. Whether you're a seasoned investor or new to the market, TradingView offers the essential resources to inform your trading decisions and stay ahead in the fast-paced world of digital assets.

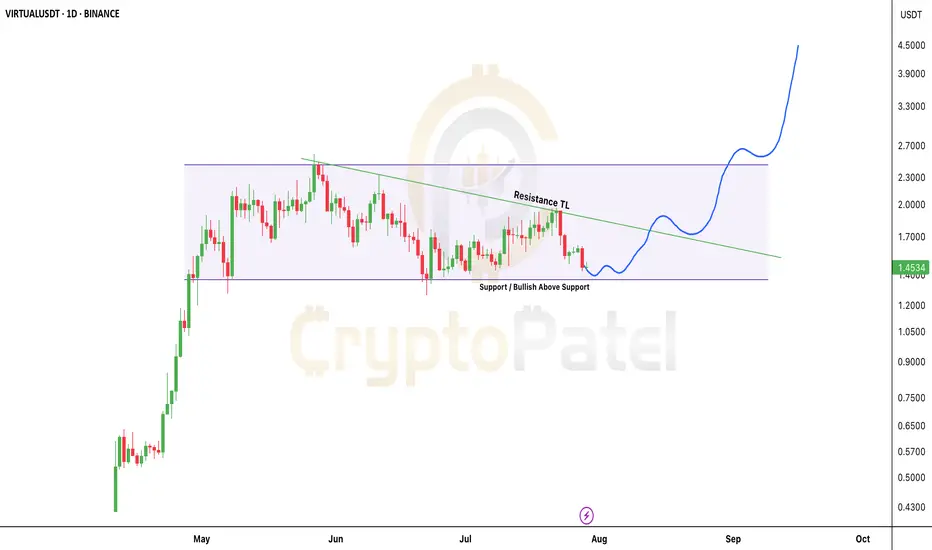
$VIRTUAL Gaining strength- hold above $1.30 could send it to $5$VIRTUAL/USDT: SPARKS:VIRTUAL is Gaining strength- hold above $1.30 could send it to $5+
Price is respecting the accumulation range between $1.30–$1.60 with multiple successful retests of the demand zone at the base.
🔹 Structure: Accumulation phase within a descending triangle
🔹 Support: Strong base at $1.30 – bulls defending this level consistently
🔹 Resistance: Descending TL compressing price- breakout imminent
🔹 Bias: Bullish above $1.30
Expectations:
✅ Clean breakout above the TL (~$1.60) will flip structure bullish
✅ Post-breakout targets: $2.00/$2.70/$4.50+
✅ If $1.30 continues to hold as HTF support, I’m expecting $5+ in the coming days.
Invalidation: Any HTF close below $1.30 shifts the bias.
Watch for breakout volume- confirmation will trigger rapid upside movement.
NFa & DYOR
is $VIRTUAL about to fly to $8?Don’t ignore this setup – is SPARKS:VIRTUAL about to fly to $8?
Price action is currently displaying a bullish flag structure on the daily chart — a continuation pattern following a strong impulse leg.
🔸 Impulse Move (Flagpole): +335% vertical rally
🔸 Consolidation Phase: Descending parallel channel forming the flag
🔸 Market Structure: Bullish continuation intact as long as the lower trendline holds
Technical Levels:
▪️ Support Zone: $1.30–$1.10 (confluence of demand & trendline support)
▪️ Breakout Confirmation: Clean daily close above $2.00 with elevated volume
▪️ Projected Target: $8.18 (measured move = flagpole height from breakout level)
Observations:
▪️ No structural breakdown observed — price respecting flag support
▪️ Volume remains muted during consolidation — typical in bullish flags
▪️ Breakout potential increases if price compresses toward apex with decreasing volatility
Invalidation: Break below $1.10 on high volume would shift bias neutral/bearish.
Strategy: Watch for breakout + retest confirmation above $2.00 to target $8.18. Risk can be defined below lower trendline support.
Note: NFa & DYOR

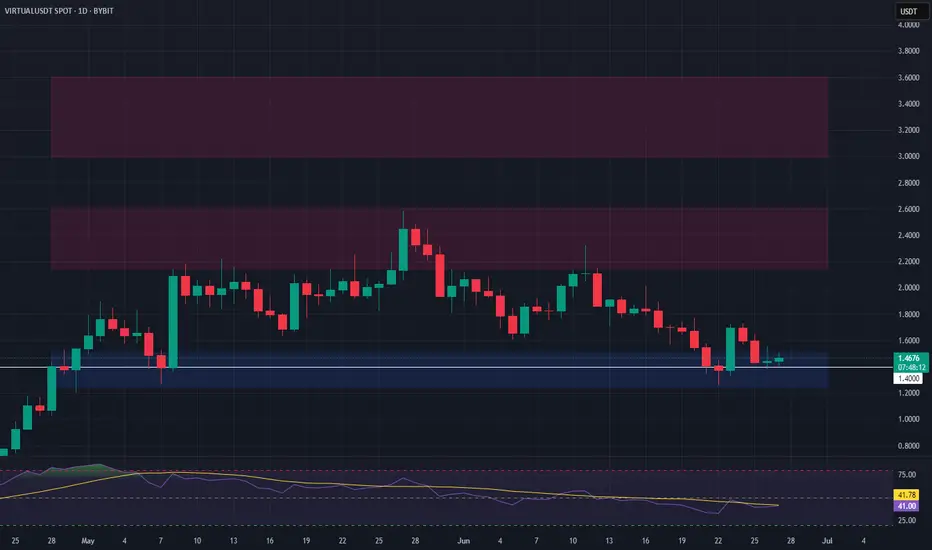
VIRTUAL Long Setup – Watching Key Support with BTC CorrelationVIRTUAL is approaching a major support zone, with a potential long spot entry dependent on Bitcoin stability. We’ll be looking to enter around the $1.50 level, provided it holds as support.
📌 Trade Setup:
• Entry Zone: Conditional on $1.50 holding as support
• Take Profit Targets:
o 🥇 $2.15 – $2.60
o 🥈 $3.00 – $3.60
• Stop Loss: Tight stop, daily close below $1.40
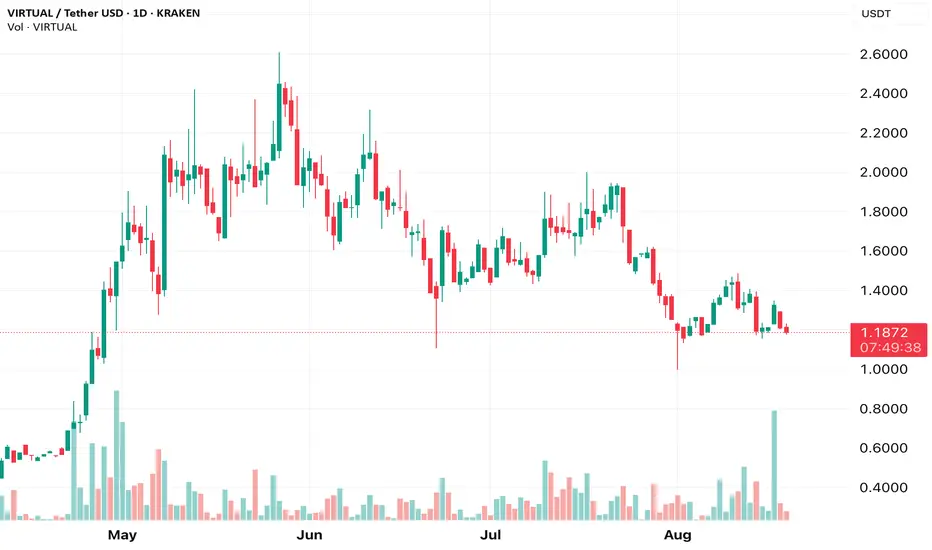
VIRTUALUSDT SHOWDOWN - SUPPORT TESTED, BREAKDOWN AHEAD?Symbol - VIRTUALUSDT
CMP - 1.6620
VIRTUALUSDT is currently consolidating within the context of a broader uptrend, forming a defined trading range. However, emerging technical signals within this range suggest the potential for a trend reversal and subsequent decline.
Bitcoin, meanwhile, appears to be entering a corrective phase following its recent rally. This development is generally unfavorable for altcoins, which often struggle to gain momentum in the absence of strength from Bitcoin. VIRTUAL is exhibiting signs of consolidation, yet there is mounting pressure within the current structure, as evidenced by the clustering of resistance levels across the range. A key risk factor is the potential breakdown of market structure through a downward exit from the ascending channel, marked by a breach of trendline support.
A renewed test of the key support level at 1.5810 could serve as a catalyst for a breakdown, potentially leading to a sharper decline. Below this threshold, there is a relatively unimpeded path toward the next significant target around 1.1780
Key Resistance Levels: 1.7200, 1.8290
Key Support Levels: 1.5810, 1.4160, 1.1780
Market participants should closely monitor the current trading range between 1.5810 and 1.8290, Persistent pressure on the support level at 1.5810, particularly in the context of a broken uptrend, constitutes a bearish signal. A decisive breach and subsequent consolidation below this level may prompt liquidation events, accelerating a move toward the fair value gap (FVG) or liquidity zone near 1.1780
