NASDAQ LongLong NASDAQ. Supports are very well followed by the market. Elections time(Volatility will be higher than usual)
Trade ideas

Nasdaq100 Long Term Chart has a big divergence built upNasdaq100 Long Term Chart has a big divergence built up - will it visit the bottom of the channel. This maybe the once in a century correction if that happens.

Nasdaq Ustech 100 buy on dipcsl today low we will see new ATHDisclaimer -
This information is only for educational purposes, this is not for any buy or sell recommendations .
On Our Harmonic pattern indicator
based trade setup take trade as explained below :-
ENTRY -
When price breaks 30% retracement Which is D points then take Entry on Buy or Sell Trade
SL -
SL is (-3%) Which is mentioned in Chart . our SL is just above or below of Recent high or Low .
TARGET -
Target 1- (T1 : 61.8 %)
Target 2- (T2 : 88.6 %)
Target 3- (T3 : 127.2 %)
Target 4- (T4 : 161.8 %)
Please note:-
It's working on news based and volitile market very well so exit if SL hit

NDX - NASDAQ100 - At Support - 12% Discount - Good level to addNASDAQ:NDX is trading at 12% discount from the top. It is also at a major support level. It is a good level to aggregate more.

Ustech 100 buy given at 18750 sl 18600, 19000, 19210,19770 TargtDisclaimer -
This information is only for educational purposes, this is not for any buy or sell recommendations .
On Our Harmonic pattern indicator
based trade setup take trade as explained below :-
ENTRY -
When price breaks 30% retracement Which is D points then take Entry on Buy or Sell Trade
SL -
SL is (-3%) Which is mentioned in Chart . our SL is just above or below of Recent high or Low .
TARGET -
Target 1- (T1 : 61.8 %)
Target 2- (T2 : 88.6 %)
Target 3- (T3 : 127.2 %)
Target 4- (T4 : 161.8 %)
Please note:-
It's working on news based and volitile market very well so exit if SL hit

NDX Reversal starts from Monday itself 19500As per technical analysis. Since Indian market at #ATH MONDAY a big reversal rally will start and it will continue till us ELECTION results

Nasdaq Ustech 100 making bas and ready for fly again Disclaimer -
This information is only for educational purposes, this is not for any buy or sell recommendations .
On Our Harmonic pattern indicator
based trade setup take trade as explained below :-
ENTRY -
When price breaks 30% retracement Which is D points then take Entry on Buy or Sell Trade
SL -
SL is (-3%) Which is mentioned in Chart . our SL is just above or below of Recent high or Low .
TARGET -
Target 1- (T1 : 61.8 %)
Target 2- (T2 : 88.6 %)
Target 3- (T3 : 127.2 %)
Target 4- (T4 : 161.8 %)
Please note:-
It's working on news based and volitile market very well so exit if SL hit

NAS100 View!Everyone says when the U.S. sneezes, the world catches a cold. Citi analysts say a slowing U.S. economy and incoming interest rate cuts by the Federal Reserve should not undermine emerging markets too much. But a potential return of former U.S. President Donald Trump to the White House might make things a little more complicated.
The assassination attempt on the Republican candidate last week has prompted a wave of repricing of the odds of a Trump victory. But Citi suggests it is too early to assume a 'Trump 2.0' is fully priced in as the election factor will intertwine with Fed easing drivers

Nasdaq completes a routine correction inside a Bull marketThis is the weekly chart of the Nasdaq 100; the most recent dip comes after a five-wave advance on the chart. So the decline is only a correction along the path of a larger up trend—wave ii of 3 in this case, where wave 3 can continue to ward 22377. Support is at 19581 and 19344; one of the two should hold.

NAS100 view!TSMC rises, lifts chips stocks after upbeat results
Domino's Pizza slumps after Q2 same-store sales miss
D.R. Horton falls after tightening home sales forecast
Warner Bros Discovery jumps on report of mulling break-up plan
Jobless claims higher than expected
Futures: Dow down 0.19%, S&P 500 up 0.25%, Nasdaq up 0.67%

Nasdaq 100 in downmove.Looking like last upward wave is finished with RSI divergence & downward move is already started on weekly chart in NASDAQ 100 index.

NASDAQ100US100 has shows us a will go down, this may a reversal from HH. we may see more sell offs right after the rectracement, our entries will be snipers entries or nothing, remember we have patience and we are wait for our time to come. All trades must be taken after retracement. Use proper risk management, Lets Download Success .

A long term correction could be due in the American MarketsThrough the Fibonacci Projections , it seems like their upcoming US elections could have the ability to trigger a year-long correction if anything unexpected were to happen.
If NDX were to break its ATH we can expect the up move continuing.

Wall Street set to fall as megacap chip, tech stocks tumbleChip stocks slump on China trade worries, tech rout
J&J flat after cutting annual profit forecast
Lilly down as rival Roche reports early data for obesity pill
Spirit Airlines shares slip after lowered Q2 forecast
Futures down: Dow 0.28%, S&P 500 0.96%, Nasdaq 1.46%

Buy Nasdaq Ustech at 19800 near SL 19600 Target big upside ChartDisclaimer -
This information is only for educational purposes, this is not for any buy or sell recommendations .
On Our Harmonic pattern indicator
based trade setup take trade as explained below :-
ENTRY -
When price breaks 30% retracement Which is D points then take Entry on Buy or Sell Trade
SL -
SL is (-3%) Which is mentioned in Chart . our SL is just above or below of Recent high or Low .
TARGET -
Target 1- (T1 : 61.8 %)
Target 2- (T2 : 88.6 %)
Target 3- (T3 : 127.2 %)
Target 4- (T4 : 161.8 %)
Please note:-
It's working on news based and volitile market very well so exit if SL hit

NAS100 Wall St set for muted open after mixed bank results!US producer prices rise moderately in June
JPMorgan profit jumps; shares dip in choppy trading
Wells Fargo drops after profit falls on deposit costs
BNY up after Q2 profit rises
Futures: Dow up 0.05%, S&P 500 up 0.02%, Nasdaq down 0.01%

Huge selling in NASDAQ after Big upsideNasdaq may face resistance around 20100-20500
Nasdaq is up almost 100% from 2023 lows
And there are 3 channels are working in Nasdaq
One medium term channel is working from 2020 and other 2 channels are short term
With the price action there is Weekly RSI that also around the resistance levels.
So be caution around these levels.
Thank you !!
Disclaimer : We are not SEBI registered analyst. Do your own research before taking any investment decision.

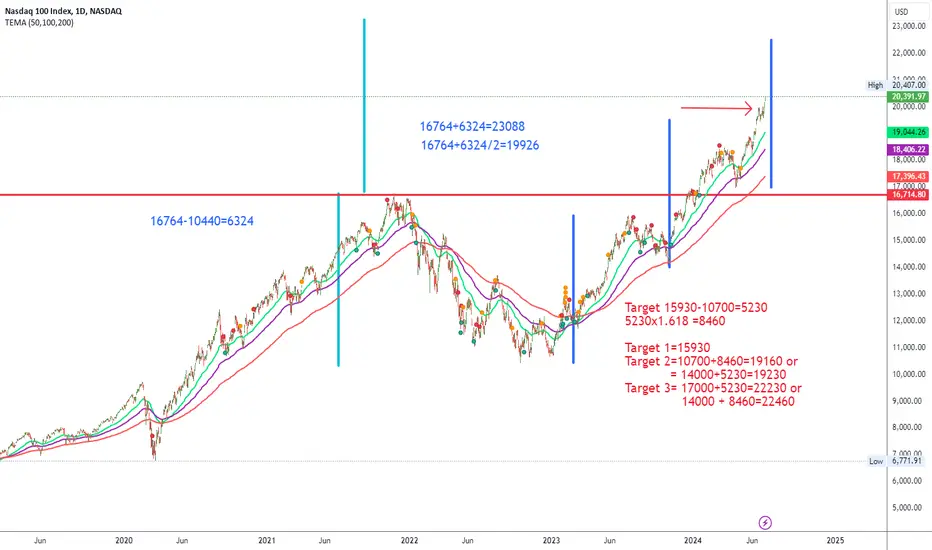
Nasdaq 100 index 20000 hits ! Ready for correction next week ?
We are arrive peak of peak of history, but trend might resume after the coming rest based on the calculation of 1x and 1.618 at its lowest point of the up trend
Looking at the patterns of up trend we have experienced 14000,17000 correction period, are we now ready for 20000 correction point and the bull restarts after good rest?
U.S. stocks see gains fizzle, but not without first-half fireworU.S. STOCKS SEE GAINS FIZZLE, BUT NOT WITHOUT FIRST-HALF FIREWORKS
The main U.S. stock indexes ended lower on Friday after an early rally ran out of gas as investors digested in-line inflation data.
Earlier in the session, the S&P 500
SPX
, Nasdaq Composite
IXIC
, Nasdaq 100
NDX
, the FANG index
N
NYFANG
, S&P 100 (.OEX), Russell 1000
RUI
, and S&P 1500 (.SPSUP) were all on track to post record closing highs. However, when the closing bell rang, none of these indexes scored fresh all-time closing highs.
In any event, the Nasdaq Composite, up 18.1% YTD, and the S&P 500 up 14.5%, have posted strong first half of the year gains. The Dow
DJI
is up just 3.8%.
Ten of the 11 S&P 500 sectors are higher so far this year with tech
S5INFT
, up 27.8% YTD, the leading gainer. Real estate
S5REAS
, off 4.1%, is the only sector in the red.

Nas100Nas100 should go downwards, to our demand, from the demand we can take swing trade with confirmation, This will be a good opportunity, currently we can short it in LTF

NAS100 upcoming weekly bias Nas breaks ATH
Thers no liq upside
so it comes to take liq
thers get confirmation to see 4 hr swing tcf confirmation

US100 -AI Bubble I'm seeing a bearish pattern forming, this might be a Ai bubble burst which will result the index to fall below 15k
Exiting all Tech -Stocks here and building futures Short In Indian market

Bearish RSI divergence on NASDAQ Price is moving upward in bear wedge pattern on weekly & daily chart. Last wave is touching resistance line. So be cautious about upward movement in NASDAQ. It can surprise with sudden big fall.
