Nasdaq currently at avoid zome wait for fed event buy on dip Parameter Data Data
Asset Name Nasdaq 100 E-Mini Futures (NQ)
Last Traded Price (LTP) 🟡 25,780.75 (Reference: Dec 8, 2025)
Price Movement 🟢 Positive (+48.75 points / +0.19%)
Current Trade 🟡 Contraction/Range-Bound Active
SMC Structure 🟡 Indecisive/Compressing (Price consolidating between major Suppl
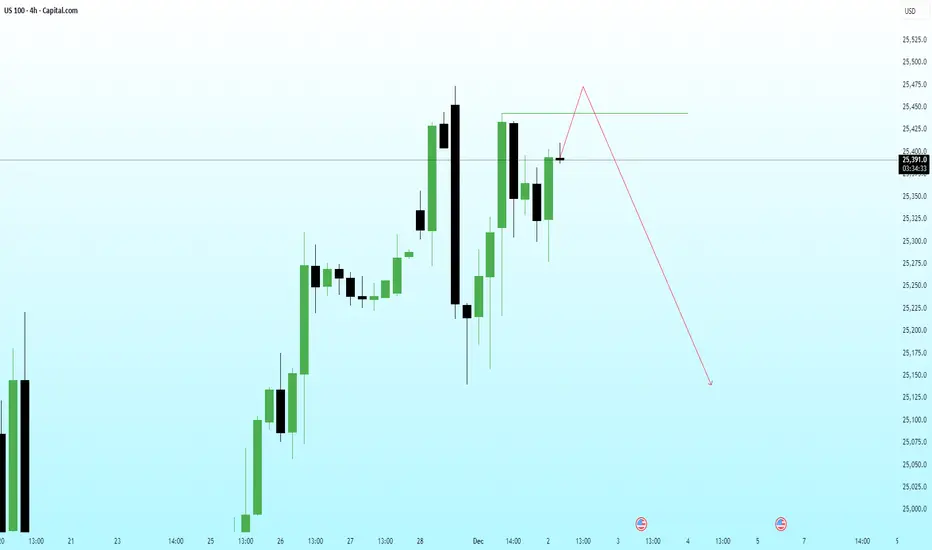
NAS100 – Anticipating a Liquidity Grab Before a Deeper CorrectioPrice is currently hovering just below the short-term resistance, displaying signs of exhaustion. I’m expecting one final push to sweep the liquidity sitting above the recent high (marked zone).
Once that engineered high is taken, a sharp reversal remains the highest-probability path—supported by h
Nasdaq 100 under pressureAfter the Nasdaq 100 fell by more than 3% in the week ending Friday 21 November, the index may extend those losses in the coming days. Recently, the Nasdaq 100 has been trading in a downtrend. Momentum has weakened, as indicated by the relative strength index (RSI), which formed a bearish divergence

Nasdaq Nasdaq is now scenario is sell buy trend change may take more then year let's wait and see let's share u r ideas

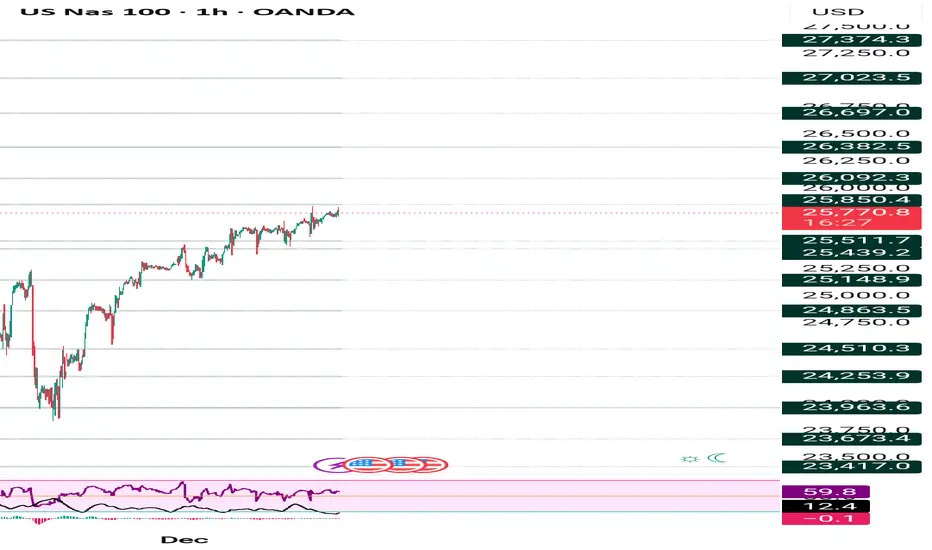
NAS100 Squeeze High on hourly Timeframe possible sharp fall downNAS100 is currently in a squeeze-high zone on the hourly timeframe, which often signals a potential sharp move down, especially with upcoming Fed news. This squeeze-high pattern typically represents an accumulation phase before smart money decides to make a significant move. In this case, it indicat

NASDAQ - Possible moves [Wave Theory]I'm not an expert of wave theory but I have an inclination towards it. Wave theory is nothing short of brilliance!
NASDAQ seem to have completed its 5 waves and now following the ABC retracement wave.
NASDAQ:NDX should now move to its B wave and show some bounce. It should be followed by furt

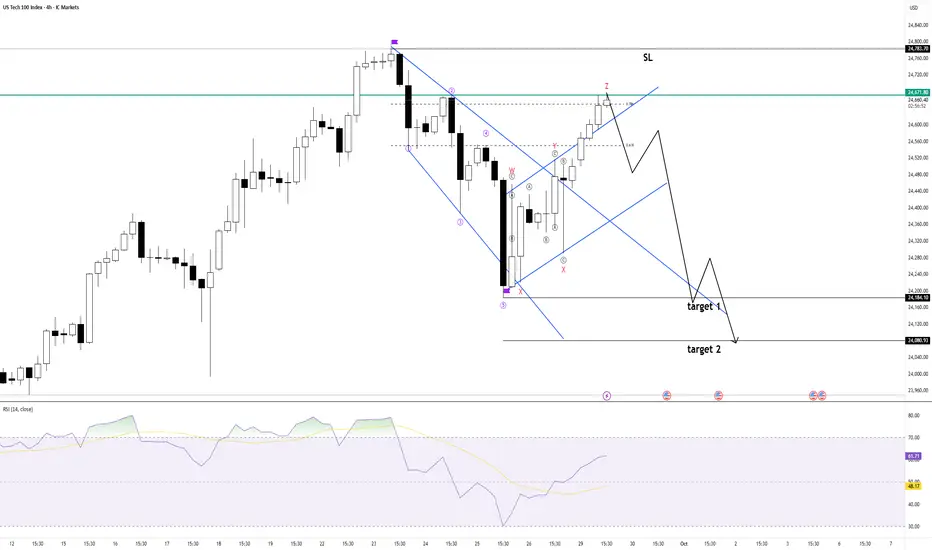
NASDAQ 100 : This is going to hurt Chart is self explanatory. Refer to marked S/R Zones
- Divergent RSI
- NNH (Net new highs) dropping fast
- Anticipatory shorts are riskier but can give a great entry.
Stop Loss - 25200 DCB

buybuy ideaPirce trend go up long term and short term last week 1h break structure pirce pull back go to 1h poi then buy

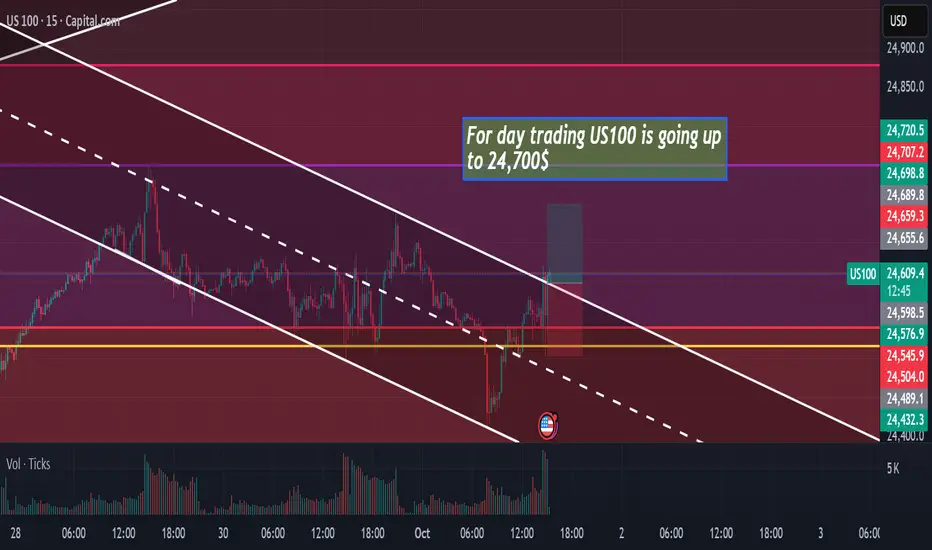
US100 is going UP TO 24,700$hello.
US100 is going up to 24,700$ in few minutes !! it's a buy opportunity on 15MIN time frame
US Tech 100 in sellI see the good risk/reward ratio sell setup in US Tech 100 as elliot wave analysis. elliot wave analysis is very complex analysis method and it aways have alternate count, how ever i shorting US Tech 100 as it gives good risk/reward ratio.
See all ideas
Displays a symbol's price movements over previous years to identify recurring trends.