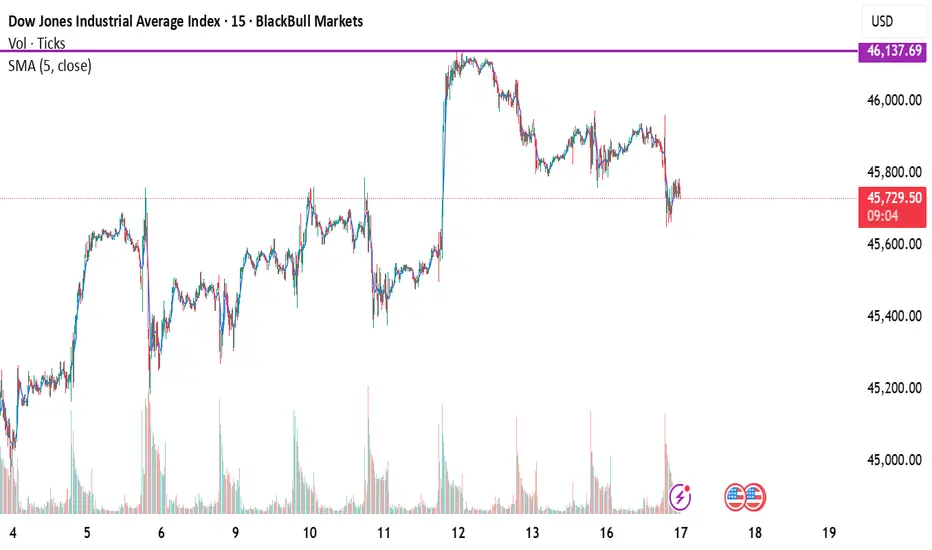
Bullish SetupPrice is currently consolidating after a recent pullback and holding above the 45,700 zone, which is acting as short-term support. If the price sustains above this level, I expect bullish momentum to continue and price to retest the recent swing high near 46,137.
📈 View: Bullish
🎯 Target: 46,137
Trade ideas
DJI - Short tradeBased on monthly range for next 1 to 2 weeks market can move down. SL last month high, for 1:3

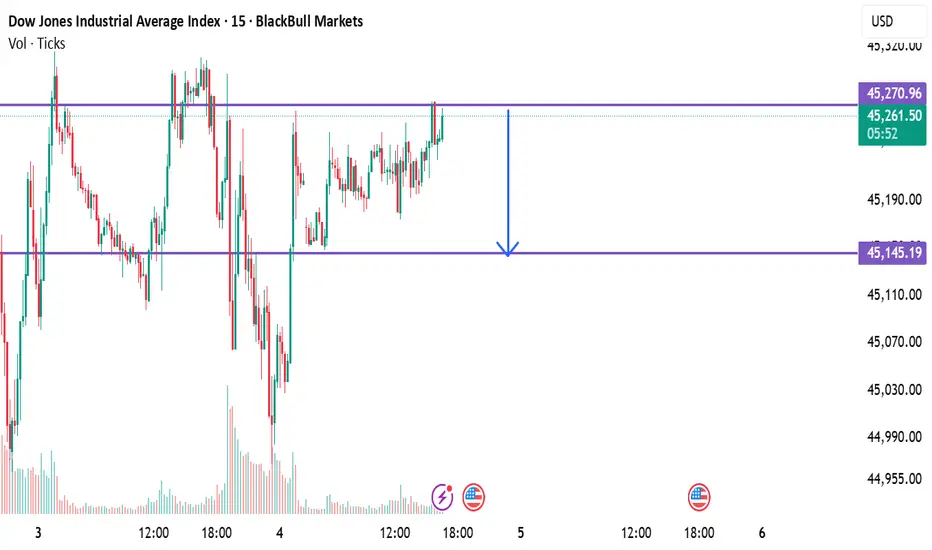
US30 short view – expecting a downside move with a target of 45,"US30 short view – bearish momentum expected with a downside target of 45,145
Dow medium term analysisDow either side will move impulsively. Moving upside looks more promising. In a months time we can see single side movement.

Dow Jones (DJI) – 4H Chart AnalysisMarket Structure:
Price grabbed liquidity (Liq) below recent lows.
A Market Structure Shift (MSS) occurred, confirming bullish intent.
Price rallied strongly after liquidity sweep, indicating smart money accumulation.
Entry Zone:
Entry placed near 45,305.93 (demand zone after MSS).
This aligns with bullish order block / demand zone where buyers previously stepped in.
Stop Loss:
SL at 44,566.45 (below liquidity sweep).
Protects against deeper liquidity hunts.
Target / Take Profit:
TP at 45,764.89 (recent swing high).
Clear liquidity resting above, providing a logical target.
Risk-to-Reward (RR):
Approx 1:2 RR (Risking ~740 points for a potential gain of ~460 points).
Good balance between safety and profitability.
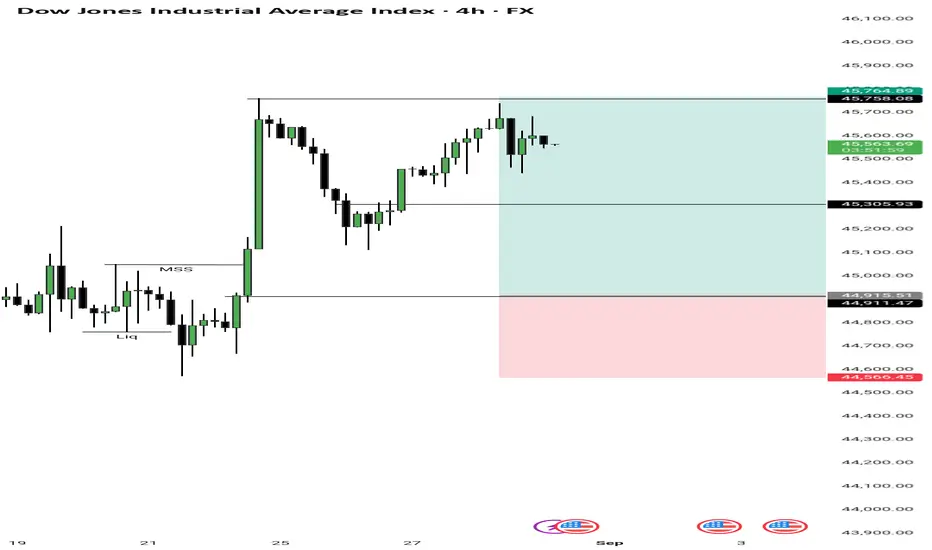
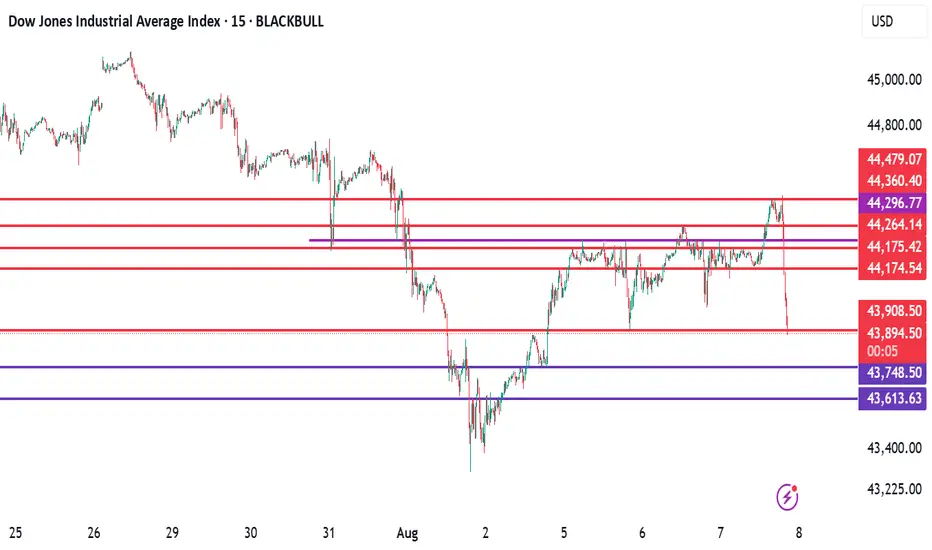
Chart Analysis - Dow Jones (Breaking Important Resistance)The US30 index has successfully broken through an important resistance level today, which is a key technical development. This breakout suggests the potential beginning of a strong bullish trend, provided the index is able to sustain itself above the red zone. If it continues to hold above this zone, buyers will likely remain in control, paving the way for higher upside targets in the coming sessions.
However, if the index fails to stay above this red zone and falls back below it, the breakout will be considered a false breakout, which could lead to renewed selling pressure and possible downside movement. In short, the red zone is the make-or-break level that will decide whether the trend continues upward or reverses.
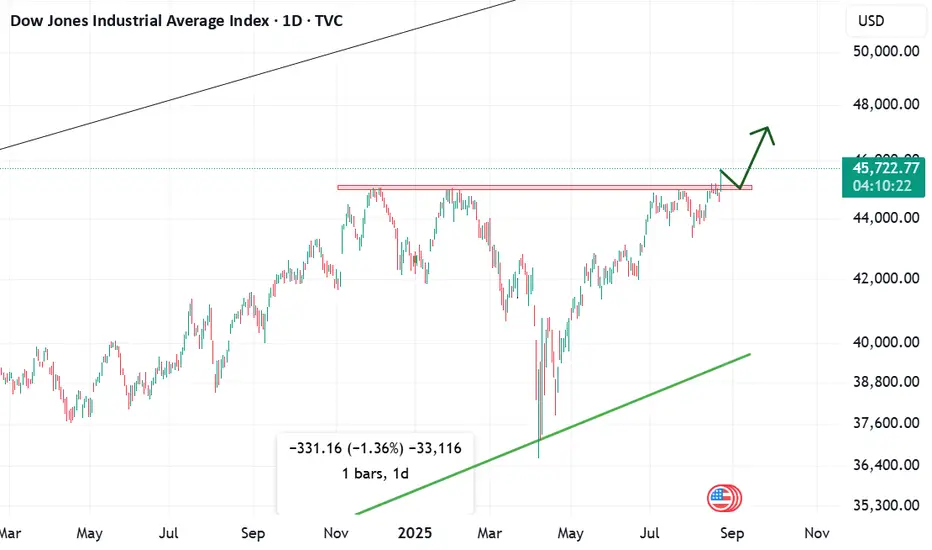
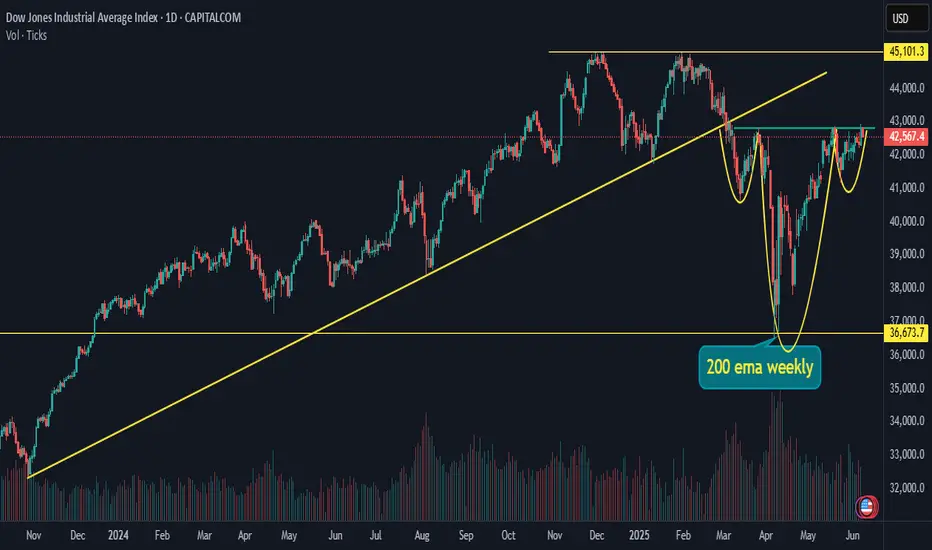
DOW JONES AT BIG BREAKOUTInverted Head and Shoulders Pattern Breakdown on Dow Jones (DJIA)
Trend Overview:
The Dow Jones has been in a downtrend before the formation of the Inverted Head and Shoulders pattern. The price shows clear signs of reversal after several months of decline, indicating a potential bullish trend.
Pattern Components:
Left Shoulder (October - December 2024):
The first major dip forms the Left Shoulder around 41,000 (Price Level), followed by a rise to 44,000, where the price peaks and starts to decline again.
Head (January - March 2025):
The price drops further, reaching a lower level of around 39,000 (Price Level), forming the Head. After this dip, the price rises again to approximately 44,000, reflecting a temporary recovery.
Right Shoulder (April - August 2025):
The price forms a higher low (around 41,500) and then rises again, signaling the formation of the Right Shoulder. The price again peaks near 44,500, but it does not drop as low as the Head, confirming the pattern.
Neckline:
The Neckline is drawn at the resistance level around 44,000 to 44,500. This is the level where the price peaks after the Left Shoulder, Head, and Right Shoulder formations.
Breakout and Confirmation:
Breakout Point:
The breakout occurs as the price rises above the Neckline, which is now being tested around 44,500. The breakout above this resistance level confirms the completion of the Inverted Head and Shoulders pattern and signals a bullish reversal.
Target Price:
The projected price target after the breakout can be calculated by measuring the vertical distance from the Head to the Neckline. If the distance is approximately 5,000 points, then the projected target after the breakout is around 50,000 for the Dow Jones.
Trading Strategy:
Entry Point:
A long position can be considered after the breakout above 44,500, with confirmation of strong momentum and volume.
Stop Loss:
A stop-loss order can be placed below the Right Shoulder, around 41,500, to limit potential losses in case the pattern fails to materialize.
Profit Target:
The first profit target would be around 50,000, derived from the distance between the Head and the Neckline.
Market Sentiment:
Bullish Reversal:
The Inverted Head and Shoulders pattern is a bullish reversal signal, indicating that the downtrend has likely ended and a new uptrend could be starting. Traders should be cautious of volatility but consider this as an opportunity to enter long positions.
Volume Confirmation:
The breakout should be accompanied by an increase in trading volume, as this indicates strong buying pressure and market conviction.
This chart setup for Dow Jones is a classic example of an Inverted Head and Shoulders pattern, offering a clear bullish signal. By monitoring the breakout level and using appropriate risk management, traders can position themselves to take advantage of potential upward movement in the index.

US30 Bullish ViewUS30 shows signs of strong bullish momentum, with buyers stepping in at lower levels. As long as the current support holds, we expect an upward move towards the target of 44,135 in the coming sessions
📈 Trend: Bullish
🎯 Target: 44,135
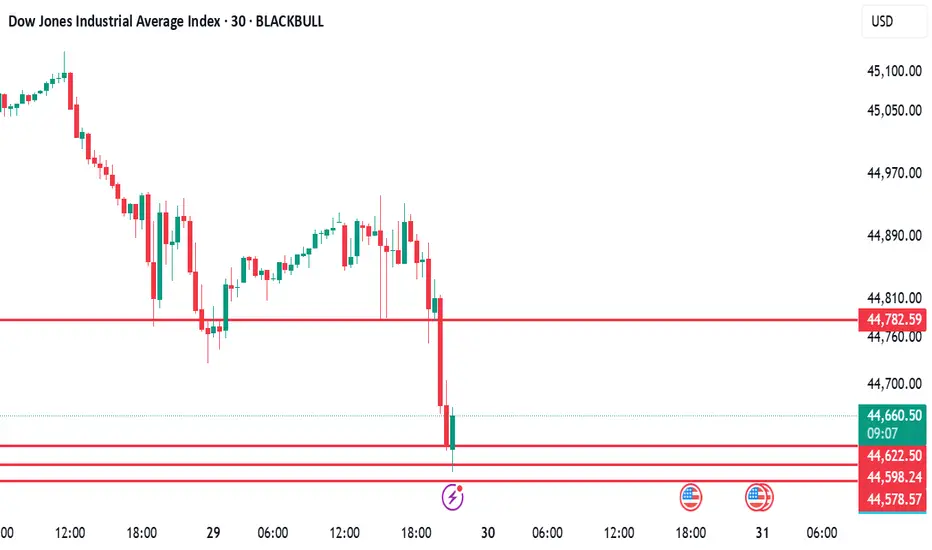
US30 Intraday View – Bullish MomentumUS30 is showing strong upward momentum and is expected to continue its bullish trend in the upcoming session. Based on current price action and technical indicators, I expect the index to move up towards the target of 44,753.
Resistance/Target: 44,753
Bias: Bullish
Timeframe: Intraday/till tomorrow
Potential sell side bias on US30Looking at a potential short position on US30, technicals confirming sell side trade while the day’s New York session move was bullish. Looking to enter shorts post confirmation.
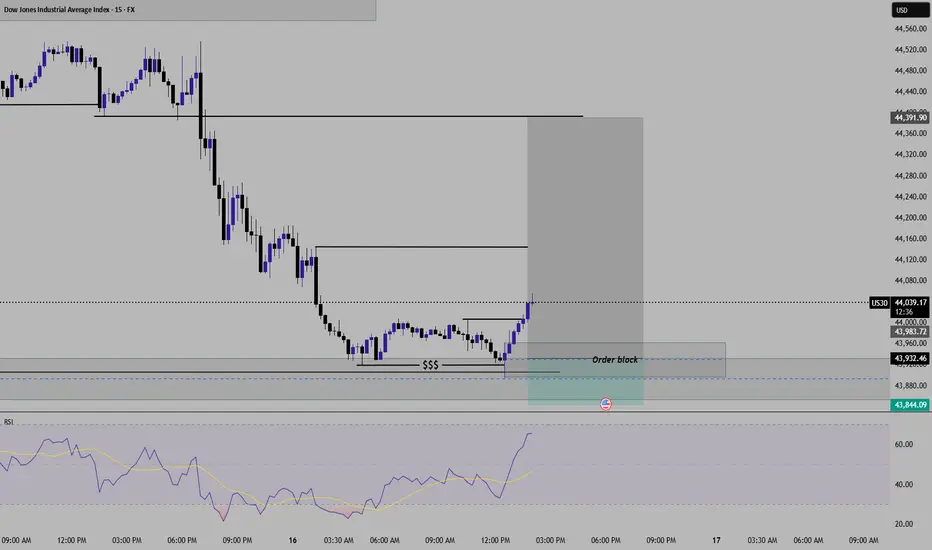
US30 Analysis for smaller time frameUS30 Buy setup With HTF Liquidity Grab Confirmation and lower time frame Entry module.
Buy @ 43925
Stop loss @43845
1st Target - @44140
2nd Target - 44390
(This publication is only for education purpose. consult your financial advisor before any investment)
US30 potential for the upsideLooking for US30 to push to the upside upon the retest of the recently created 4h/1h demand zone.Use proper risk management should you join me.

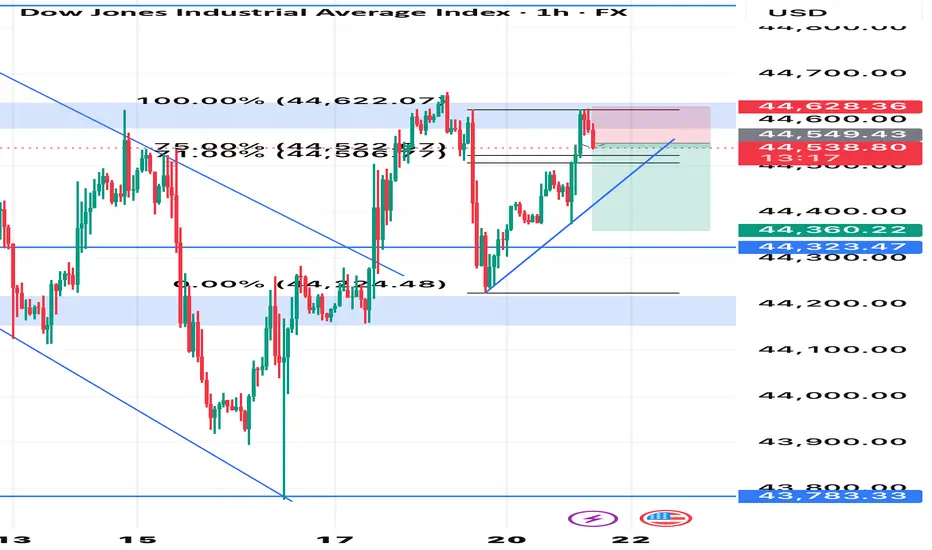
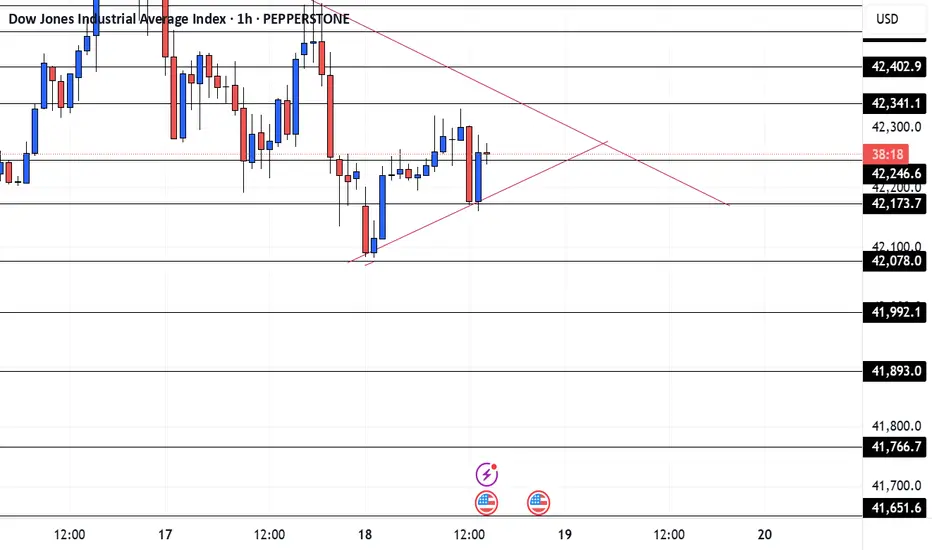
US30 JUNE 20Happy Friday, I see that price is around my key area, the top of the trendline and on my Fib extension. Everything about this trade is telling me to sell. But at the end of the day price does what she wants. So be careful and wait for a break and retest of the key level or trendline before you get in. If you have any questions don't be afraid to ask. Have fun and trust yourself
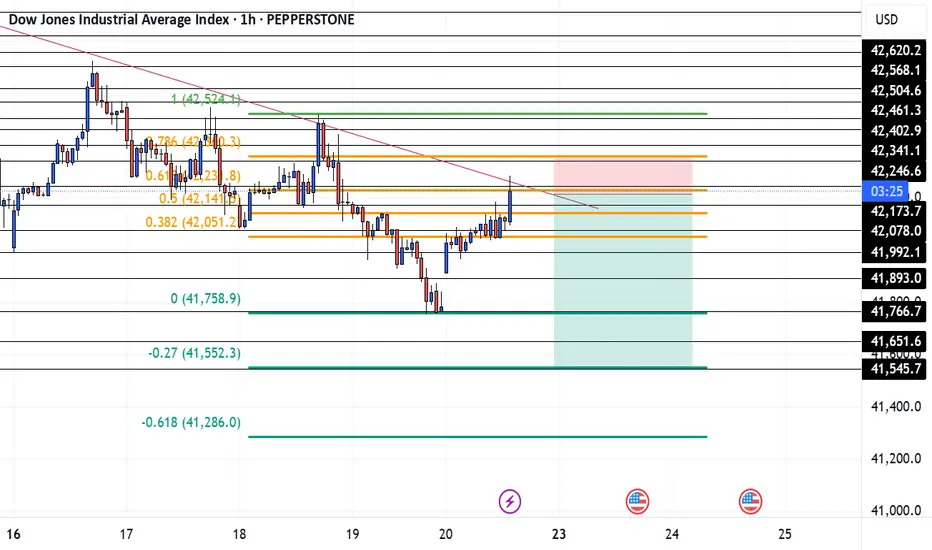
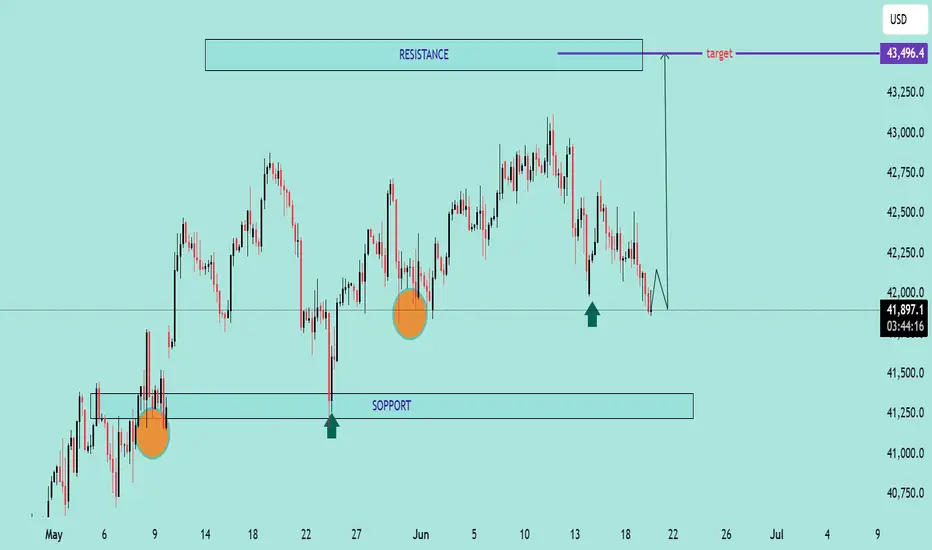
US30 Potential Rebound from Key Support ZoneUS30 Potential Rebound from Key Support Zone 🚀📊
📉 Analysis Overview:
The US30 (Dow Jones Index) is currently testing a major support zone near the 41,800–41,900 range, a level that has held firm multiple times in the past (highlighted with green arrows and orange circles). This area has acted as a demand zone, leading to strong bullish reactions previously.
🔍 Key Technical Highlights:
🔸 Support Zone: Clearly respected at ~41,800. Price is once again bouncing here.
🔸 Resistance Zone: Around 43,250–43,500. This area has acted as a ceiling, where price struggled to break through.
🟢 Reversal Indicators: Multiple successful defenses of the support zone suggest accumulation and possible bullish reversal.
📈 Target Projection: If support holds, the price may rally toward the target zone near 43,496.4, as shown by the purple arrow.
📌 Conclusion:
As long as the 41,800 support holds, US30 shows bullish potential toward the 43,500 resistance. A break below this zone would invalidate the bullish scenario and shift focus back to the lower support near 41,250.
🛑 Risk Management Tip: Watch for confirmation candles and volume before entering long positions. Always set a stop-loss below the support zone.
Bear Assault may be nearing…-With heightened geopolitical risks, equity prices can face downslide in foreseeable future.

US30 JUNE 18Price looking fine like lemon lime in the summertime. I am just going to follow the trendlines today. I'm either going to wait for a bounce to sell or buy or a break and retest through the trendline. And my take profit will just be the next key area.
I hope this helps. LMK is you don't understand.
Stay safe and have fun
US30 – Bearish Setup Below Resistance Zone US30 – Bearish Setup Below Resistance Zone 🚨🟥
The US30 index is exhibiting signs of bearish momentum after repeated rejections from the key resistance zone near 43,200. Let's break down the technical picture:
🔍 Technical Analysis
📌 Resistance Zone (🟥 43,200 area)
Price was rejected twice from this resistance (marked by red arrows), showing strong seller presence.
Bearish candlesticks followed each touch, confirming exhaustion near this level.
📌 Support Zone (🟦 40,800 area)
The area around 40,800 has acted as a strong demand zone in the past (highlighted with green arrows and orange circles).
Price might revisit this area if current bearish structure continues.
📌 Intermediate Support (🟪 41,828)
This level serves as short-term support.
If broken, it could accelerate the decline toward the major support.
📌 Market Structure
Lower highs forming after each bounce indicate weakening bullish strength.
A potential bearish breakout pattern is forming (highlighted by the projected path).
📈 Conclusion & Trade Outlook
Bias: Bearish 📉
Trigger: Break below 41,828 support
Target: 40,800 zone
Invalidation: Break and close above 43,200 resistance

BIG MOVE AHEAD The Flag and Pole pattern is a continuation pattern in technical analysis that signals a brief consolidation before the price resumes its previous trend. It consists of two parts:
- Pole – A strong price movement in one direction (either bullish or bearish).
- Flag – A short consolidation phase where price moves sideways or slightly against the trend.
The Head and Shoulders pattern is a well-known reversal pattern in technical analysis that signals a potential trend change. It consists of three peaks:
- Left Shoulder – A price rise followed by a peak and then a decline.
- Head – A higher peak than the left shoulder, followed by another decline.
- Right Shoulder – A lower peak than the head, similar in height to the left shoulder.
The pattern is confirmed when the price breaks below the neckline, which connects the lows between the shoulders and the head. This breakdown often signals a bearish reversal.

US 30 / Dow Jones / DJI forming bullish patternLooking at US30 US market is forming a bullish pattern called inverted Head and shoulder breakout can lead to a target of all time high.
US30 Technical Analysis – 8th June 2025 US30 Technical Analysis – 8th June 2025
🔍 Chart Overview:
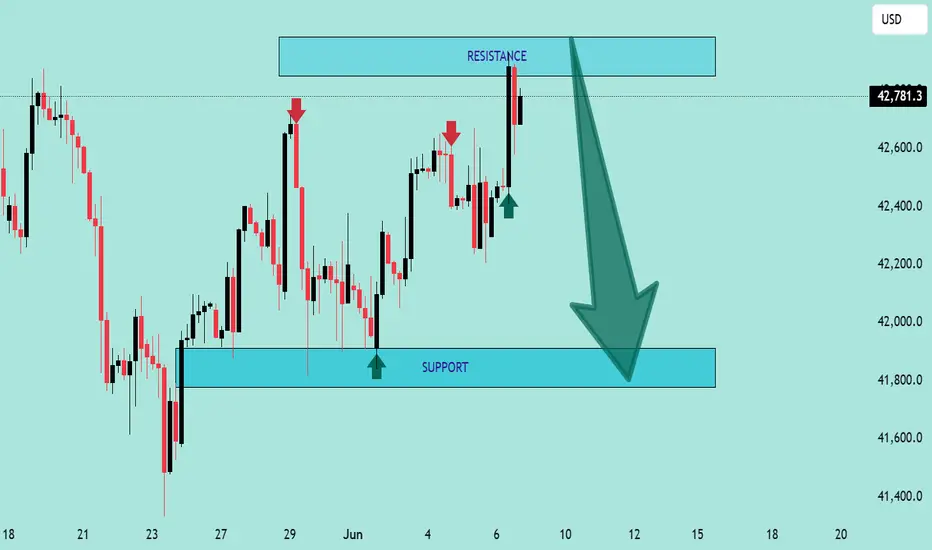
The chart shows a classic range-bound structure with clearly defined support and resistance zones.
📍 Key Zones:
🔼 Resistance Zone: ~$42,900 – $43,000
Marked by multiple rejections (🔴 red arrows).
Price has failed to close above this area convincingly.
Sellers are actively defending this level.
⚠️ Bearish pressure likely to increase if price stays below this level.
🔽 Support Zone: ~$41,750 – $41,850
Marked by strong bullish reactions (🟢 green arrows).
Buyers have stepped in consistently in this demand zone.
A breakdown below this level could trigger further downside momentum.
📈 Current Price Action:
The price is hovering around $42,781.3, just below the resistance zone.
The latest candlestick shows rejection from the top, forming a bearish wick, indicating potential reversal pressure.
The large downward arrow (⬇️) on the chart suggests a bearish bias is expected by the analyst.
📉 Outlook & Strategy:
🔻 Bearish Scenario (High Probability):
If price fails to break and sustain above $43,000, expect a move back down towards the support zone at ~$41,800.
A breakdown below support could lead to deeper downside, targeting $41,500 or lower.
🛑 Invalidation:
A clean breakout and daily close above $43,000 would invalidate the bearish setup and suggest potential continuation higher.
🎯 Trading Tips:
🔹 Short Bias: Look for short entries near resistance with tight stops above $43,000.
🔹 Target: $42,200 → $41,800
🔹 Risk Management: Always maintain a good risk-to-reward ratio and use proper stop-loss.
📌 Conclusion:
⚠️ The chart favors a bearish reversal from resistance unless bulls can push decisively above $43,000. Traders should watch for rejection patterns or breakdown confirmations to align with the bearish move.
US30 Bearish Rejection at Resistance – Potential Drop Ahead📉 US30 Bearish Rejection at Resistance – Potential Drop Ahead 🚨
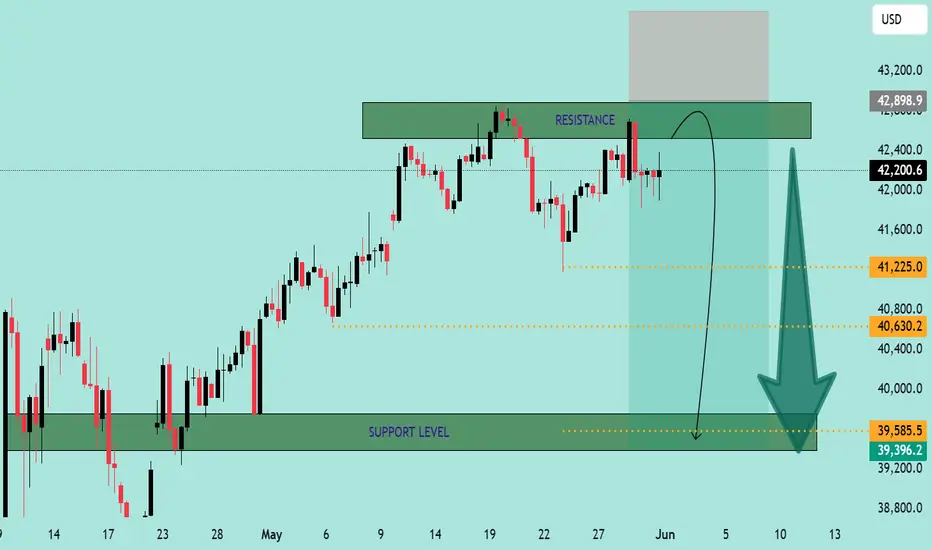
The US30 (Dow Jones Industrial Average) is exhibiting signs of bearish weakness after rejecting a strong resistance zone around 42,898.9 - 43,800.8. Here's a breakdown of the current market structure and outlook:
🔍 Technical Analysis
📌 Resistance Zone (Sell Pressure)
Price has failed to break above the marked resistance area multiple times.
Strong wicks and rejections indicate seller dominance near the top.
A short-term bounce into the resistance is anticipated before a likely reversal.
📌 Support Zone (Buy Interest)
The key support is at 39,396.2 - 39,585.5.
This zone has previously served as a strong demand area, with multiple bullish reversals in the past.
📌 Bearish Projection Path
Chart shows a potential rejection pattern playing out.
Price is expected to retest the resistance, then decline towards the support zone.
Intermediate support levels:
41,225.0
40,630.2
🔄 Outlook
🛑 Scenario A (Likely):
Price tests the upper resistance again and forms a double top or shooting star before declining toward the 39.5k support zone.
✅ Scenario B (Invalidation):
If price closes above 43,800 with strong volume, bearish bias will be invalidated, and a bullish continuation can be expected.
🧭 Trade Idea (Not Financial Advice)
🔹 Entry: Short near 42,800–43,000 (after confirmation)
🔹 Target 1: 41,225
🔹 Target 2: 40,630
🔹 Final Target: 39,585
🔹 Stop Loss: Above 43,800
Conclusion:
⚠️ The chart indicates a high-probability short setup unless bulls manage a strong breakout above resistance. Eyes on the price action near resistance for confirmation. 📉📊
us30Price action trading is a methodology where traders make decisions based on the interpretation of actual price movements on a chart, rather than relying primarily on lagging indicators. It involves observing and analyzing candlestick patterns, trend lines, support and resistance levels, and volume to identify potential trading opportunities and manage risk. The focus is on understanding the story the market is telling through its price behavior.

A buying opportunity in US30 Observations:
Trend: The market has been in a strong downtrend, as indicated by a consistent series of lower highs and lower lows.
Volume: There’s a notable spike in volume during the most recent sell-off, suggesting a possible climax or capitulation move.
Support Zone: Price appears to have bounced from a support zone between 41,745.55 and 41,855.46, shown with a shaded red/pink region.
Long Position Marked:
Entry: Around 41,914.36
Stop-Loss: Below the recent low, around 41,745.55
Take-Profit: Near 42,858.09
Risk-Reward Ratio: Very favorable (approx. 6:1 or better)
Interpretation:
This setup suggests a counter-trend long trade betting on a short-term reversal from oversold conditions. Given the:
Large volume spike (potential exhaustion of selling),
Strong support zone reaction,
Tight stop and large reward zone,
This could be a calculated risk-reward play assuming a bounce or reversal is imminent.
