Trade ideas
DJI / GOLD in a end of consolidation ZoneThe performance or price of gold might determine the future price of DJI/Equities. It looks like it is 'on the balanced state and Can stay there for some time. Meaning, the ratio can be the same, prices of both Gold and equity can rise/fall at more/ less the equal percentage.
Possible outcomes:-
1. If the ratio remains the same, then the rise/ fall in both Gold & equity more/ less remains the same.
2. If there is a increase in the ratio, meaning there is an increase in equity value and Gold remaining the same or increase in equity and a decline in Gold.
3. a)If there is a decrease in the ratio, meaning there is a decrease in equity value and Gold remaining the same or
b) Decrease in equity and increase in Gold, which is very rare to happen only when there is minimal or zero economic activity due to war on other pandemic like situation)
Leaving option 3b above, I feel we are at the end of option 1 and about to start option 2.
US30 Trading Plan - 03/Jul/2022Hello Traders,
Hope you all are doing good!!
I expect US30 to go DOWN after finishing this correction.
Look for your SELL setups.
*This BUY is risky and I am biased only for short term upside, if you dont know how to manage your trade, dont take the risk now and wait for it to break the last low for HPB .
Please follow me and like if you agree or this idea helps you out in your trading plan.
Disclaimer: This is just an idea. Please do your own analysis before opening a position. Always use SL & proper risk management.
Market can evolve anytime, hence, always do your analysis and learn trade management before following any idea
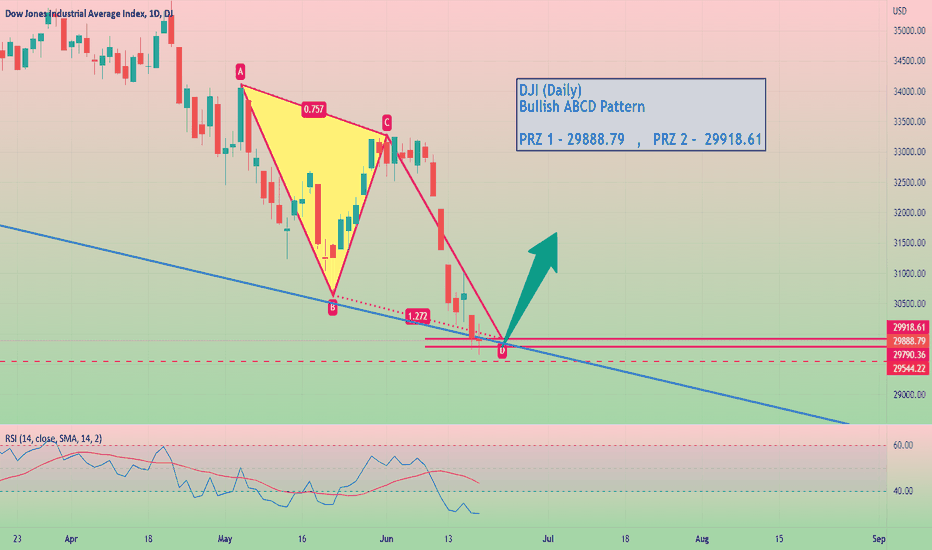
us30 Bearish broke my support according to my POVUS30 will be bullish Only if it breaks 30900 and close above it until then it will be bearish and it might reach the next support zone of 29900-29800.
US30Is it going to take the Low or form a double bottom before reversal
lets see
allocate 50% at prev Low and rest at entry point
DJIFor observation only. DJI Retracement Levels.
The information provided, including any tools, services, strategies, methodologies, and opinions, is expressed as of the date hereof and is subject to change. Backtested, hypothetical or simulated performance results have inherent limitations. Simulated results are achieved by the retroactive application of a backtested model itself designed with the benefit of hindsight. The backtesting of performance differs from the actual account performance
Is it a Doji Star in Nifty 50 followed by DJI Nifty 50 and Dow Jones Index have both formed a DOJI on Friday closing. Along with the previous days candle , is it a Doji star pattern forming up likely to be followed with an upward move on Monday. RSI too is well below the oversold zone.
Lets see what happens on Monday 20 Jun 2022. Is it the end of this fall atleast for a short NSE:NIFTY NSE:NIFTY time?


