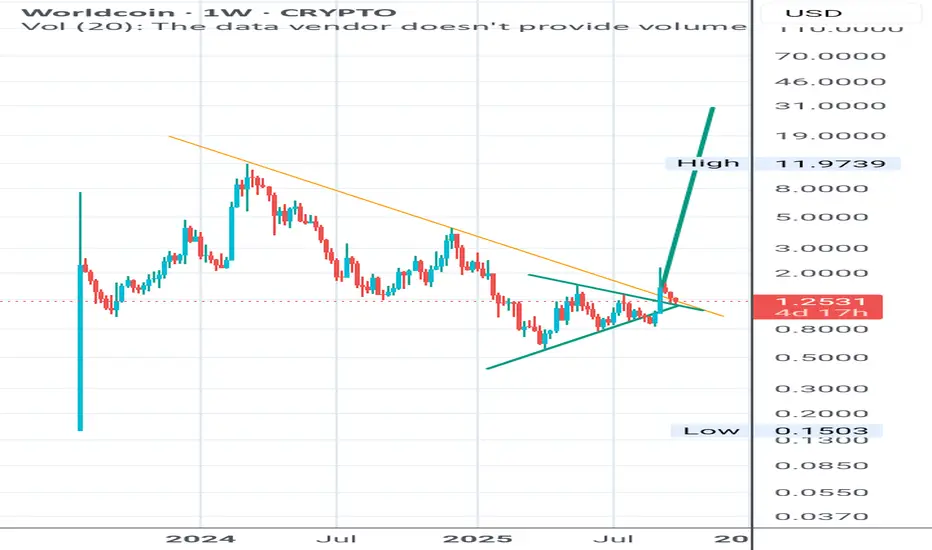
World Coin :: breakout from triangle. Hello Everyone,
I would like to present an Idea of exponential gains. Worldcoin recently broke out of two triangles; a small trinagle the price target of which has already been hit and a breakout of a very big triangle. The price is currently retesting the breakout line of the triangle. Please hav
WLD price has surged from the demand zone with the arrival of thSince this new investigation has not proved WLD guilty yet, it's less of a worry. A look at its price chart shows that the surge was due to the catalyst driven by the World ID initiative.
The WLD price has surged from the demand zone with the arrival of this proof of humanness (World-ID).
Therefor

Decoding What Happened In WLD Over Its Technical Chart
According to TradingView, from ATL to ATH, the price showed a magnificent surge of more than 6600%, and from the low registered on July 24th, 2023 of $0.1503, Its current price has traded 900% higher than its all-time low price.
Likewise in (WLD/USD-BINANCE), the all-time high (ATH) was registere

What Does Worldcoin (WLD) Price Structure Highlight on the Daily
According to Tradingview, it (WLD/USD-BINANCE) was 1200% higher than its all-time low price. The low was at $0.1503, registered on July 24th, 2023.
Likewise, the all-time high was registered on March 9th, 2024, when the price peaked at $11.76. Comparatively, from the ATH level, the price as of p

The Worldcoin (WLD) Price Action On Daily Symbolizes A FascinatiThe Worldcoin (WLD) has reached a crucial demand zone after a lot of plummetation. It has surged more than 100% in 24-hour volume and amounted to $385 Million. Its market-to-volume ratio highlights good liquidity at 62.02%, while its circulation stands at 262.677 Million WLD tokens.
The Worldcoin (W

Worldcoin (WLD) Leads The Top LosersWorldcoin (WLD) Leads The Top Losers
Worldcoin (WLD) leads the list of top losers this week, with its value diminishing by more than 17.38%. Trading around $4.96, it has seen a slight intraday recovery of 1.38%. with a current market capitalization of 1.066 Billion, the crypto ranks 80th among all.

If this weakness continuesOn analyzing the price structure on the daily chart. It has been observed, that after reaching a peak of nearly $12 on March 10, 2024, it suffered a drastic drop of nearly 65% to a bottom of $3.80 on April 13. It rapidly changed direction, causing the daily chart candle causing to close at a price o

the WLD crypto is experiencing a massive declineThe Worldcoin crypto has shown remarkable price action on the daily chart, before around March 9th, 2024, the price was favoring bulls. However, the WLD crypto exhibited deterioration afterward as the price tumbled from a crucial level of around $11.75 on the chart. On the chart, the shift of wind i

WLD to 20 to 25
GPT-5, World Chain
Bottom ticked at the 3.7, done.
Next stop for WLD is somewhere between 20 and 25.

Bid the Sam Alman token!What did the world just witness over the last few days?
The Social Capital of Sam Altman now compared to what it was even a week ago is easily 10x.
WLDUSD to 25 in the near term, who knows may even be 250 in the bull market.
Bid it now, and keep adding it along.

See all ideas
Summarizing what the indicators are suggesting.
Oscillators
Neutral
SellBuy
Strong sellStrong buy
Strong sellSellNeutralBuyStrong buy
Oscillators
Neutral
SellBuy
Strong sellStrong buy
Strong sellSellNeutralBuyStrong buy
Summary
Neutral
SellBuy
Strong sellStrong buy
Strong sellSellNeutralBuyStrong buy
Summary
Neutral
SellBuy
Strong sellStrong buy
Strong sellSellNeutralBuyStrong buy
Summary
Neutral
SellBuy
Strong sellStrong buy
Strong sellSellNeutralBuyStrong buy
Moving Averages
Neutral
SellBuy
Strong sellStrong buy
Strong sellSellNeutralBuyStrong buy
Moving Averages
Neutral
SellBuy
Strong sellStrong buy
Strong sellSellNeutralBuyStrong buy
Displays a symbol's price movements over previous years to identify recurring trends.