WTICOUSD trade ideas

Look for small reversal from this point. Price after a big fall will reverse a little for sure, so just try to capture that reversal after conforming that in lower time frame and enter long and exit as soon as you are in profits.

$ 42.15 acts as resistance. Price will climb until $ 42.15 will reject from there and once again climbs up and breaks this resistance levels and reach the Box resistance. Refer previous analysis/ check the related ideas.

$ 1 trading range for the few days.Price trading inside a box which is $ 1 range. Now making symmetric triangle pattern and it might break on either side.
Wait for the box breakout and enter the trade accordingly. If you are an aggressive trader then enter the market when price takes support from the symmetric triangle.

USOIL symmetrical triangle pattern formation in 30 mins TFUSOIL symmetrical triangle pattern formation in 30 mins TF

CRUDE OIL : trying to move up intradayBuy crude oil for intraday trading keeping the sl 42$ for the target of 43.5 /43.8

Expecting Crude Oil to Crash Crude oil has made Decending Triangleon monthly chart since 2008 clear indication of a crash.

WTI . Weekly Technical Analysis UpdateMidterm forecast:
. While the price is below the resistance 43.60, beginning of downtrend is expected.
. We make sure when the support at 37.15 breaks.
. If the resistance at 43.60 is broken, the short-term forecast -beginning of downtrend- will be invalid.
Technical analysis:
. There is a divergence in RSI and price between the peak at 40.565 on 2020-06-08 and the peak at 43.595 on 2020-08-05, the probability of uptrend continuation is decreased and the probability of beginning of downtrend is increased.
. While the RSI support #1 at 52 is not broken, the probability of price decrease would be too low.
. A peak is formed in daily chart at 43.60 on 08/05/2020, so more losses to support(s) 42.30, 38.85 and minimum to Major Support (37.15) is expected.
. Price is above WEMA21, if price drops more, this line can act as dynamic support against more losses.
. Relative strength index (RSI) is 59.
❤️ If you find this helpful and want more FREE forecasts in TradingView
. . . . . Please show your support back,
. . . . . . . . Hit the 👍 LIKE button,
. . . . . . . . . . Drop some feedback below in the comment!
❤️ Your Support is very much 🙏 appreciated! ❤️
💎 Want us to help you become a better Forex trader ?
Now, It's your turn !
Be sure to leave a comment let us know how do you see this opportunity and forecast.
Trade well, ❤️
ForecastCity English Support Team ❤️

USOILStuck in a range $41-44. Should BO/BD of this range for further move. Global uncertainties are not able to provide any direction. Trade as per levels in the chart
Again rejecting from Previous highPrice as expected breaks long time resistance and exactly rejecting from the previous high levels. Forming Ascending triangle pattern at the moment, wait for the break and enter.

Pattern break and target achieved. As expected the pattern was broken and the target for the pattern is achieved.


My view on WTI Crude oil for next 5 yearsBuy WTI Crude oil @ 20$ - 25$
Stop loss on the monthly closing basis @ 15.40
Target for next 5 years @ 110.40
Technical :- There is a long term positive divergence formation on the weekly and monthly chart "or" Falling wedge pattern formation. I think that has become the bottom of crude oil, So I'm bullish on WTI Crude oil.
Note :- How did you like my analysis? Please give your opinion through comments.
Disclosure :- This analysis has been done for educational purpose only. There is no advice on our part to invest, So before making any kind of investment, you must consult your financial advisor.

USOIL Ascending triangle pattern formation in 30 mins TFUSOIL Ascending triangle pattern formation in 30 mins TF


Took Strong support once again. Will break $ 43Price again rejected from $ 43 levels and went back to $ 41.5 last Friday and as expected it bounce back fro m that level. Since it tested $ 43 levels many times in a short span of time it has all possibilities to break this levels in coming week. Get ready !!


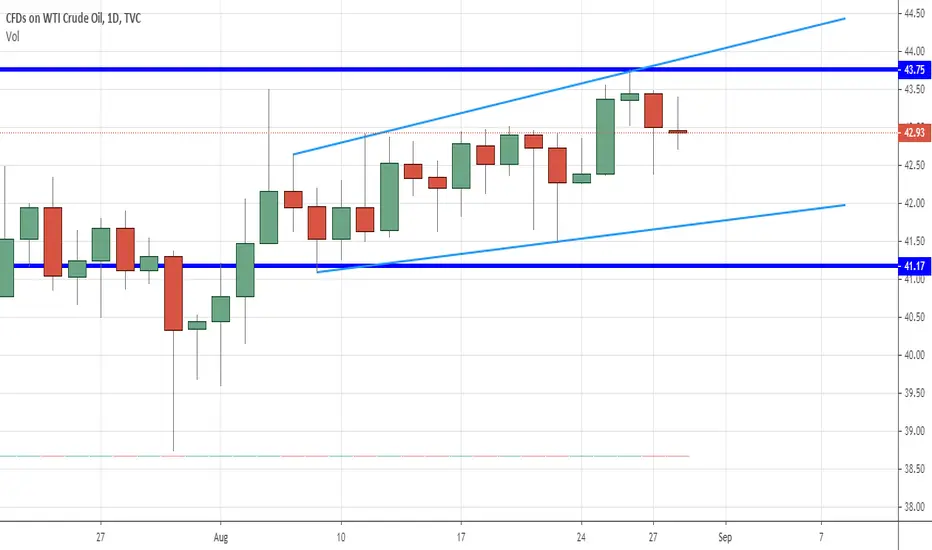
USOIL sellPrice is currently buying and selling in an upward channel. I expect price to sell and break channel to sell towards support zone 41.86.


Price rejecting from ResistancePrice as expected took support at the bottom yesterday and rejected at the resistance. Yesterday candle denotes that, price is strongly bullish and will move up breaking the resistance. Wait for the reversal and go long.

Took support - Looking for the break !!Price formed a pattern and took support from the bottom, looking for the price to break the previous high and make new high. . .
