GE30 in longI see the good risk/reward ratio buy setup in GE30 as elliot wave analysis. elliot wave analysis is very complex analysis method and it aways have alternate count, how ever i buying GE30 as it gives good risk/reward ratio.
Trade ideas

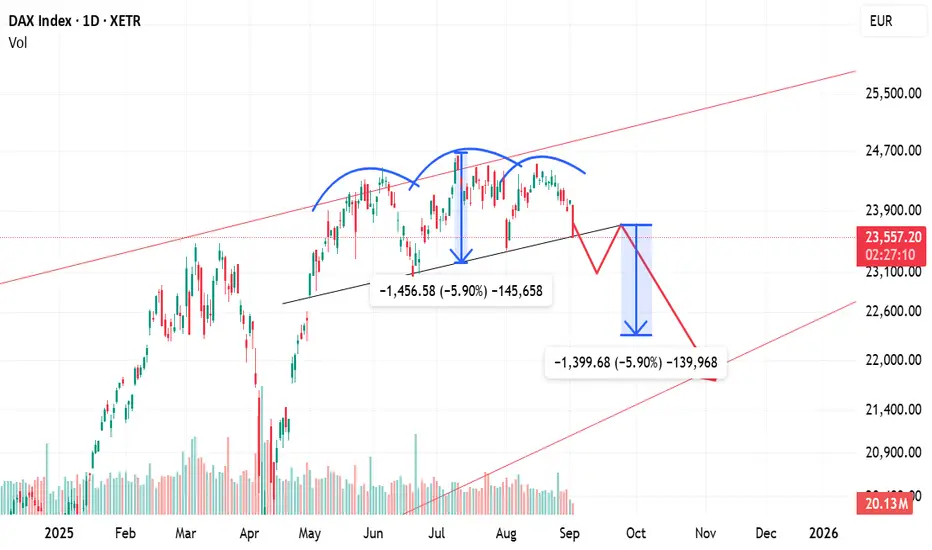
DAX Breaks H&S Pattern – Eyes 22,300–22,200🔎 Chart Setup
DAX has given a breakdown of the Head & Shoulders pattern on the daily chart. This is a strong bearish reversal pattern, usually signaling further downside.
⚖️ Downside Targets
With the breakdown confirmed, the pattern target lies in the 22,300–22,200 zone.
As long as 24,000 (on a closing basis) is not reclaimed, the bearish bias remains intact.
🔄 Retest Scenario
After such breakdowns, it’s common for the index to retest the neckline.
In this case, a pullback up to 23,700 is possible before resuming the downward move.
✅ Summary
DAX has entered a bearish phase after breaking down from the Head & Shoulders pattern. Unless it closes back above 24,000, the path of least resistance remains down toward 22,300–22,200.

Head & Shoulders on DAX Daily Chart – Watch for BreakdownThe DAX index is currently forming a Head and Shoulders pattern on the daily chart, a well-known bearish reversal formation. This pattern typically signals a potential shift in trend from bullish to bearish if the breakdown occurs.
Left Shoulder – Formed when prices peaked, followed by a correction.
Head – A higher peak, marking the top of the uptrend, followed by another decline.
Right Shoulder – A lower high compared to the head, showing weakening bullish momentum.
Neckline – The key support line connecting the lows between the shoulders and the head.
⚖️ Implications
If the DAX breaks below the neckline with strong volume, it will confirm the pattern.
This breakdown could trigger further downward momentum, with potential targets calculated by measuring the distance from the head to the neckline and projecting it downward.
✅ Summary
Pattern: Head & Shoulders (bearish) on daily chart.
Trigger: Breakdown below the neckline.
Outcome: Increased probability of further decline, with downside targets extending to lower support zones.
GER40 BUY TODAY RUNNING SMOOTHLYI saw a setup forming on the charts in 5 minutes. Took a Ger40 Buy according to my setup. I just entered another buy which I have shown on the charts. It is currently running around 1;3. my target in the second buy is 1;7 ish. I will hold 1st buy till my TP reaches. Sharing just to show you guys.

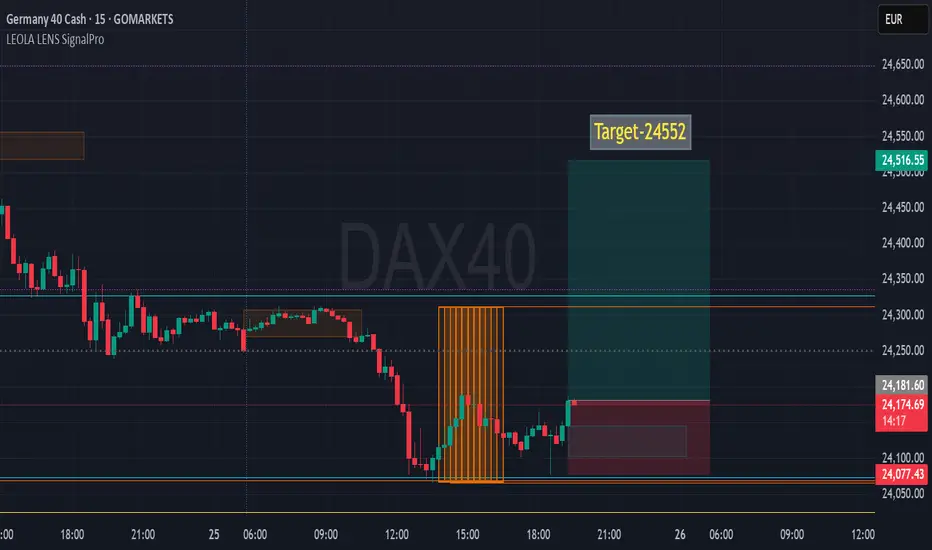
DAX40 Recovery Setup-Potential Upside to 24552After a significant intraday selloff, DAX40 shows signs of a potential recovery as price reclaims the earlier support zone with strength.
🔍 Key Observations:
✅ Yellow box marks a cluster of bars after a strong downtrend, hinting at accumulation or exhaustion.
⚠️ Support retest held — recent candles show signs of rejection from the lower bound near 24,077.
📈 Leola Lens SignalPro structure suggests a potential shift in bias — upside projection mapped to 24,552 as the next key level.
📊 Clean invalidation zone below recent wick lows.
💡 Educational Insight:
This setup emphasizes the importance of price structure, volume balance zones, and trend exhaustion for anticipating reversals. Traders can study how institutional-style tools like SignalPro help highlight such shift moments with visual clarity.
GER30|GER40 - 1:8 RR TRADEThis went as expected. Loved this tradE. I lost a total 0.8% in 4 trades in the morning but recovered & gained 1.4% in just one trade. My Risk to Rewards are very high so even low accuracy works.

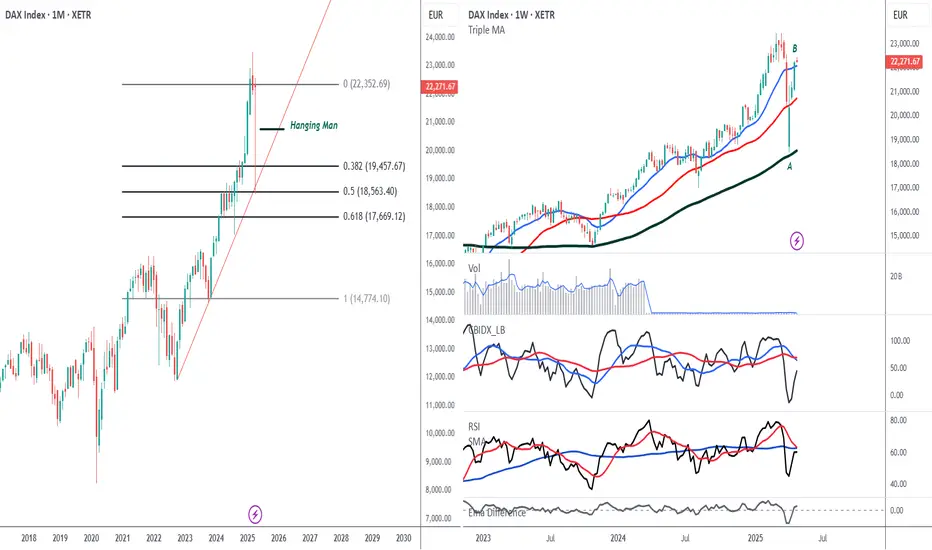
Global cuesDAX CMP 22272
Candlestick- the Index fell 17% from the highs during the month and then regained most of the fall. The size of the lower wick is a sign of warning. In Japanese candlestick pattern it is a long term reversal candlestick pattern called the Hanging Man . At times after a big fall the bears just test the bulls to see till where they can pull the mkt. So the bears say that if this what u can pull up to then ur hanged.
Elliott - This rally is the B wave and will go up no further. The C wave downfall will start from here.
Oscillators- RSI is back to the bear zone on the weekly charts and also below the MA cross. This is very bearish. Second the composite is below its MA cross.
Conclusion- We are a global mkt and we rise together and fall together. Hence cues from anywhere is most welcome. Both these are higher time frame charts and hence investors should keep an eye on them. In my view caution is the view for next two months.
Dxy,bitcoin,gold,indices. (All in one)So we are comparing dollar index with gold and bitcoin and global indices, in this video you will get best knowledge to go with best trading strategies.

21-08-2024, GERMAN 40 - SHORTS 1. for long term we are seeking premium (LONGS) targeting (18790.01) price level
2. during this perticular day (21-08-2024), we are going short to sweep 4hr Sellside Liq to go up
- looking for shorts in between the dealing range targeting 4hr low (monday low,19-08-2024)

15-08-2024 - GERMAN 40 (longs) 1. A clear draw on DAX targeting 18096.47 price level
2. It might not hit the target today but we are working on L0NGS in the specified dealing range
3. Dealing range and the next Draw are mentioned in the chart

25-07-2024_ Looking for shorts (GER 30) 1. Daily view
- as we are looking for bearishness in a weekly range (MON-FRI) perspective,from Monday to Tuesday NY session price gives us the Judas swing
- due to the Daily imbalance (BISI) a little confussion wether that BISI push price higher as we can see there are 4hr equal highs
- And yesterday we got the conformation is that the Daily imbalance is no longer holding price and it inversed and now we can look for shorts after a Liq sweep, (targeting FRIDAY'S low)
2. Weekly view
- we are looking for bearishness and if we continue the bearish OF we are most likely be reaching for the MAY and JULY low

Bearish RSI divergence on DAXOn weekly chart DAX has bearish RSI divergence on weekly chart. Be cautious with longs.

GER30I am expecting a good bullish market from here. Use proper risk management. Lets Download Success

DAX Looks Supported todayYou can make an argument that the DAX is very overextended, as we have rallied quite drastically.
The German DAX initially pulled back a bit during the trading session on Friday, but it does look as if there are buyers underneath, especially near the €16,600 level.
This is an area that has offered support recently, and the fact that we have bounced from that bottom does suggest that we probably have further to go to the upside.
Overextended?
You can make an argument that the DAX is very overextended, as we have rallied quite drastically. The 16,000 level is an area that a lot of people have paid close attention to, and of course, it is a large, round, psychologically significant figure. Furthermore, the 50-day EMA is crossing the general vicinity, so I would be especially interested in buying the DAX on a pullback to that area. However, I also recognize that we may not pull back, rather we could just go sideways. Either way, we need to work off some of the excess froth, which is because we have gone straight up in the air since the end of October. Stocks are overbought worldwide, and the DAX of course is not going to be any different.
If we were to simply rally from here, the €17,000 level is an area that a lot of people will pay attention to as potential resistance, as we have sold off from that area. It’ll be interesting to see how this plays out, because we are either going to see a pullback that buyers will take advantage of due to value, or we will go sideways. I will be watching the €16,500 level very closely because it is a short-term support level. If we break down below there, then we find even more value. During this time of year, I tend to put on small positions, and then build those positions up as the trade proves itself to be correct. This allows me to essentially “dollar cost average” on the pullback. With this, as exactly how I’m going to trade the DAX going forward over the next several weeks.

GER 40 - for 6.11.2023
As seen in the previous few sessions, the index has significantly moved up breaking all the resistances. Now it has arrived at an important daily resistance range of 15280 - 15300 (20 points).
If it Breaks the support level of 15120, we can look for a good short opportunity with a range till 15030 (approx 100 points) or the index could experience periods of consolidation, with volatile fluctuations in both upward and downward directions.

#DAXThis is only my view #dax is in negative zone above 15950 positive
1 SUPPORT IS 15873
2 SUPPORT IS 15828

Short sell DAXGerman DAX has been consolidating in a range for a while now and today it is breaking below the key level where it was bouncing from. This is on the back of the jobs data from the US but it had been pretty weak even before that. We are looking at the target of 15,000 in the index.

DEU40 | Europe (German Index) is ready to roarDEU40 | Europe (German Index) is ready to roar
Flag setup in Daily time frame

dax gernmanyThe German index is just 3% away from an all-time high
strong outperformer against global peers.
now at 15875, can move beyond the 16300 mark
on the downside good as long as hold the 15250-15300 area

DAXactually publishing herewith my 2 old ideas one weekly dtd.13.03.2023 and other dtd.17.03.2023
just to show importance of inside candle and impact of monthly line(white)


DAX & ARCPublishing herewith another example of Arc using DAX as an example, here we are using 3 arcs

Dax dayRe-publishing herewith my idea about DAX using day time frame, price is still moving in a zone
