XRP/USDXRP/USD(BITFINEX)
Ripple recently tested the $0.40 resistance level and couldn't break the same with dropping to $0.32 level(19%) recently.
Bullish Case:
If the manages to hold $0.32 price level and breaks the 0.38$ level then it would be slightly bullish for the asset.
Bearish Case:
There is a lack of buying interest(volume) and if It broke the $0.32 support level and closes below the green line with strong sell volume then it will be highly bearish case for ripple with a target of price level below $0.30.
XRPWCRO_E83FFA.USD trade ideas


XRP-USDhopefully we can stay above the purple/pink trenddailyline, the 15 minute broke also as the 1hour 2hour 4hour, only the daily is holding it atm, if it goes below the 0.363xx prev. low candle, ecpect a drop.
Another scenario is we go sideways, and just extend the trendline..
My game: i placed a small long entry under the purple/pink dailytrendline, aiming it will go up in the next couple of days, a tight stoploss has been placed around 0.36xx. trade safe!


Ripple Long-Term ViewRipple(XRP/USD)
Ripple
Overview
Ripple(XRP/USD) has suffered about 91+% correction(drop) since all time high-level price($3.3+) reached in January’18.It has seen significant upward movement in the month of September’18(110+%) and is now retesting a major support level.
Let us continue to analyze price action for Ripple(XRP/USD) over the long term and proceed to highlight any potential areas of support and resistance moving forward.
Long-Term Analysis (Monthly Timeframe)
Scenario 1: Bullish (Uptrend)
The bullish argument one can see on the XRP/USD chart is that it has been respecting the long-term trend-line(since July'17) pretty well. The trend-line was tested in September'18 which lead to a movement of 110+% upside. It is retesting again now and we might see an upside movement to the Resistance Zone 1 ranging from $0.63--$0.71 if the Support Zone from $0.16--$0.29 holds well.
Support Zone is quite a strong area of bounce as its the previous year resistance now turned support.
If Ripple held the trend-line then it might follow path "1" as specified in the chart.
If it manages to close above "Resistance(Sell) Zone 1" then it will retest "Resistance(Sell) Zone 2" ranging from -$0.84--$0.98 within few months which might show some sign of bullish confirmation.
Stochastic RSI is also in the oversold region with an upward trend.
Scenario 2: Bearish (Downtrend)
If the monthly candle(December) closes below $0.28 and the trend-line doesn't hold up then we might follow the path "2".
If the trend-line is broken with strong sell volume then the trend-line will act as a strong resistance area to break in the future.
Generally, if the trend-line is retested multiple times then it becomes weaker.
Note: Monthly time frame charts illustrates the movement of price over a long-term horizon and are most often used by long-term investors.
Short-Term Analysis (Daily and Weekly)
Scenario 1: Bullish (Uptrend)
The weekly chart of (XRP/USD) shows that the long downtrend line(red dotted) has been broken with significant buy volume showing bullish signs.
It tested the support zone and jumped 110+% in September'18 proving this zone to be strong support.
If this support zone held in the coming weeks/month then we might retest the Resistance Zone 1 ranging from $0.58--$0.70.
We get the confirmations of the next bull cycle only if the Resistance zone 2 ranging from $0.88-$1 is broken with significant buy volume.
Scenario 2: Bearish (Downtrend)
If the support zone is broken with significant sell volume then we might test area of $0.07-0.14$ price levels and support zone will act as a strong resistance area to be broken in the near future.
News and event analysis:
One of the major catalyst which happened in the past that, 42nd President of the United States Bill Clinton was a keynote speaker in the Swell conference held in the October'18.
Many banks are experimenting with its Ripple network(xRapid) for money transfer across borders.
There is still decision to be made by SEC(USA) authorities whether or not Ripple is security.
Conclusion:
Ripple remains in 2nd position, in terms of overall market cap rankings along with Bitcoin and Ethereum.
The 65-month-old coin is now experiencing its first bear market and has already corrected enough(91% down) to commence its new bull cycle in coming weeks/months.
People likely showed interest in Ripple as it offers a cheap alternative in terms of asset price when compared to bitcoin and other crypto assets with good fundamentals.
The only concern lies with Ripple is of categorizing it to be a Security which might lead to retail traders not able to participate in trading.

RIPPLE: 2 PLANS for 2 Scnearios! Very NICE moment to BUY or SELLHey tradomaniacs,
welcome to a trading plan for XRP/USD!
Important: Wait how the market reacts at the trendline and follow the direction!
-----------------------------
Type: Swingtrade
PLAN A: Short (Trendfollow)
Sell-Limit: 0,445
Stop-Loss: 0,57593
Target 1: 0,28221
Target 2: 0,21561
------------------------------
PLAN B: Long (Trendchange)
Buy-Limit: 0,50
Stop-Loss: 0,41274
Target 1: 0,57639
Target 2: 0,75
Target 3: 0,93202
-------------------------------
REMEMBER:
The market is very uncertain and volatile. Still look at correlations of BTC and ripple
and watch the Kign carefully. We could easily end up with a SHORT-SQUEEZE which is going to dump all coins.
PLAN B has a short-term-target because this could also end in a FAKE-OUT!
LEAVE A LIKE AND A COMMENT - I appreciate every support! =)
Peace and good trades
Irasor
Wanna see more? Don`t forget to follow me.
Any questions? PM me. :-)


XRP LOWER TARGET OF .14 COMING SOON......XRPUSD HEADING FOR A LOWER TARGET OF .14 IN THE COMING WEEKS IF IT BREAKS .27 LEVEL..SO I SUGGEST NO MORE BUYING UNTIL IT
TOUCHES .14 AND BE CAUTIOUS ON ALL CRIPTOS AS BTC IS HEADING TOWARDS 1400 LEVELS SOON...


Ripple - technical analysis - support and resistance levelsRipple has a support at barrier band 0.43-0.47 and a resistance at barrier band 0.67-0.70. I have coined the term barrier band for the first time :)


XRP Has lost 90% of its value from highs of Dec 2017XRP used to be $3.8 and now it has seen $0.33
Will it ever go up.
Highly doubtful

There is a possibility for the beginning of uptrend in XRPUSD Technical analysis:
. RIPPLE/DOLLAR is in a range bound and the beginning of uptrend is expected.
. The price is below the 21-Day WEMA which acts as a dynamic resistance.
. The RSI is at 34.
. While the price downtrend in the Daily chart and the RSI is not broken, bearish wave in price would continue.
Trading suggestion:
. There is still a possibility of temporary retracement to suggested support zone (0.450 to 0.320). if so, traders can set orders based on Price Action and expect to reach short-term targets.
Beginning of entry zone (0.450)
Ending of entry zone (0.320)
Entry signal:
Signal to enter the market occurs when the price comes to "Buy zone" then forms one of the reversal patterns, whether "Bullish Engulfing" , "Hammer" or "Valley" in other words,
NO entry signal when the price comes to the zone BUT after any of reversal patterns is formed in the zone.
To learn more about "Entry signal" and the special version of our "Price Action" strategy FOLLOW our lessons:
Take Profits:
TP1= @ 0.55
TP2= @ 0.65
TP3= @ 0.77
TP4= @ 0.94
TP5= @ 1.18
TP6= @ 1.60
TP7= @ 2.34
TP8= @ 2.87
TP9= @ 3.53
TP10= Free

There is a possibility for the beginning of uptrend in XRPUSD Technical analysis:
.RIPPLE/DOLLAR is in a range bound and the beginning of uptrend is expected.
. The price is below the 21-Day WEMA which acts as a dynamic resistance.
. The RSI is at 36.
. While the price downtrend in the Daily chart is not broken, bearish wave in price would continue.
Trading suggestion:
. Price is in the Support zone (0.450 to 0.320), traders can set orders based on Daily-Trading-Opportunities and expect to reach short-term targets.
Beginning of entry zone (0.450)
Ending of entry zone (0.320)
Entry signal:
Signal to enter the market occurs when the price comes to "Buy zone" then forms one of the reversal patterns, whether "Bullish Engulfing" , "Hammer" or "Valley" in other words,
NO entry signal when the price comes to the zone BUT after any of reversal patterns is formed in the zone.
To learn more about "Entry signal" and the special version of our "Price Action" strategy FOLLOW our lessons:
Take Profits:
TP1= @ 0.55
TP2= @ 0.65
TP3= @ 0.77
TP4= @ 0.94
TP5= @ 1.18
TP6= @ 1.60
TP7= @ 2.34
TP8= @ 2.87
TP9= @ 3.53
TP10= Free

AROON What is the 'Aroon Indicator'
The Aroon indicator is a technical indicator that is used to identify when trends are likely to change direction. In essence, the indicator measures the time that it takes for the price to reach the highest and lowest points over a given timeframe as a percentage of total time. The indicator consists of the "Aroon up" line, which measures the strength of the uptrend, and the "Aroon down" line, which measures the strength of the downtrend.
BREAKING DOWN 'Aroon Indicator'
The Aroon indicator was developed by Tushar Chande in 1995 as a way to assess the strength of a trend by looking at the time that it takes for the price to reach its high and low points over a given period of time.
The two component lines are calculated as follows:
Aroon Up - ((N - Days Since N-day High) / N) x 100
Aroon Down - ((N - Days Since N-day Low) / N) x 100
The N is the number of periods used for the indicator. By default, many traders use the Aroon indicator over 25 periods.
The Aroon Up and the Aroon Down lines fluctuate between zero and 100, with values close to 100 indicating a strong trend and values near zero indicating a weak trend. The lower the Aroon Up, the weaker the uptrend and the stronger the downtrend, and vice versa. The main assumption underlying this indicator is that a stock's price will close at record highs in an uptrend, and record lows in a downtrend.
This indicator is very similar to the directional movement index (DMI) that was developed by Welles Wilder, which is also a very popular indicator used to measure the strength of a given trend and the likelihood that it will reverse direction.
The Aroon indicator is best used in conjunction with other forms of technical analysis that can be used as confirmation.

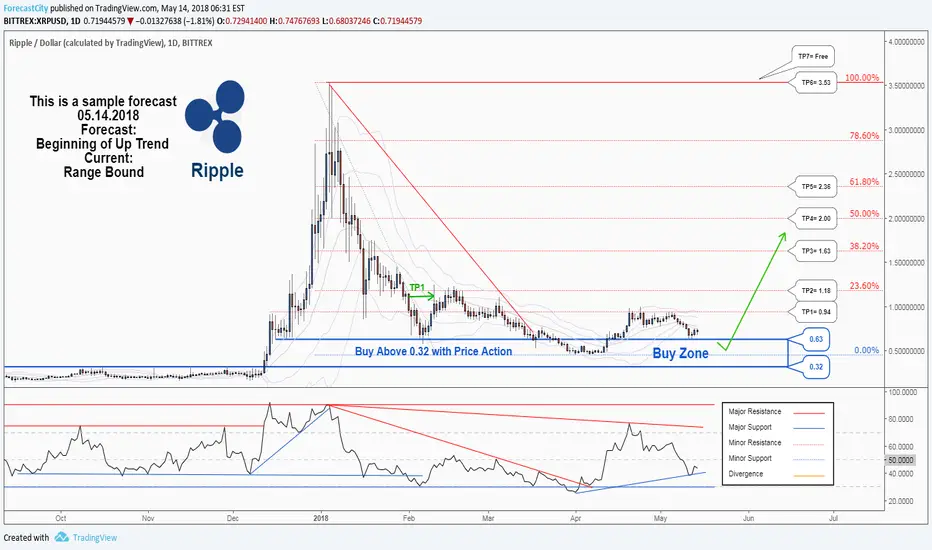
There is a possibility for the beginning of uptrend in RippleTechnical analysis:
. RIPPLE/DOLLAR is in a Range Bound and Beginning of up trend is expected.
. The price is below the 21-Day WEMA which acts as a dynamic resistance.
. The RSI is at 44.
Trading suggestion:
There is a possibility of temporary retracement to suggested support zone (0.63 to 0.32). if so, traders can set orders based on Daily-Trading-Opportunities and expect to reach short-term targets.
. Beginning of entry zone (0.63)
. Ending of entry zone (0.32)
Entry signal:
Signal to enter the market occurs when the price comes to "Buy zone" then forms one of the reversal patterns, whether "Bullish Engulfing" , "Hammer" or "Valley" , in other words,
NO entry signal when the price comes to the zone BUT after any of reversal patterns is formed in the zone.
To learn more about "Entry signal" and special version of our "Price Action" strategy FOLLOW our lessons:
Take Profits:
TP1= @ 0.94
TP2= @ 1.18
TP3= @ 1.63
TP4= @ 2.00
TP5= @ 2.36
TP6= @ 3.53
TP7= Free
Ripple analysisRipple also riding at the correction areas in which buy after that can take profit up to targeted areas
currently ripple in the major support of 0.318 fibo level
if the bullish ride starts from this can make abc wave correction to the targeted areas
