Trade ideas

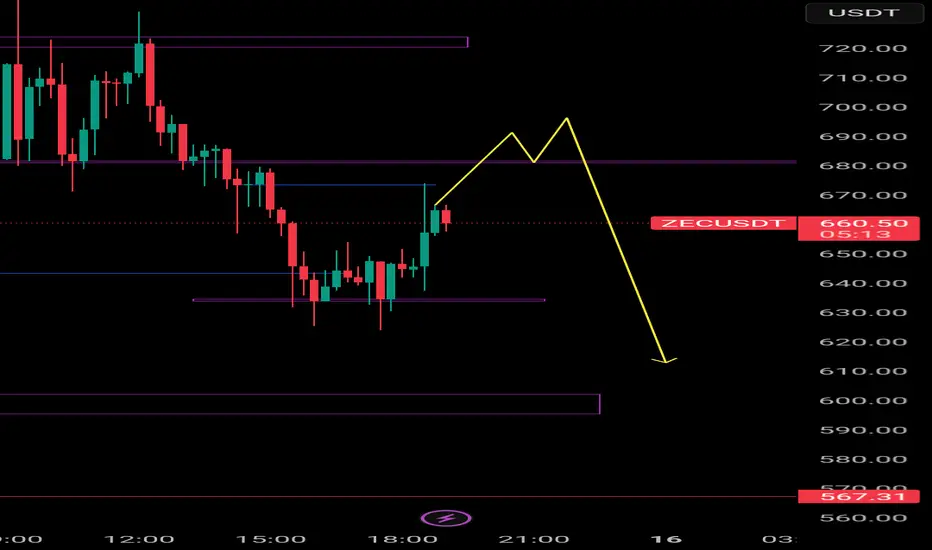
ZecI am looking for sell here with huge R:R will look for the corrections here. We will plan buy from the base

Zecusdt Hi all look for sell here it's a correction in trend will catch this move tp is high here. Will look for buy in downside.


Zecustd sell side Look for sell with confirmation of lower lower..it's a upper trend chart. We are playing correction
$ZEC Price Analysis — Trend Shift Detected! CRYPTOCAP:ZEC Price Analysis — Trend Shift Detected!
#ZEC recently faced rejection from the $548 resistance, forming a visible descending trendline on the 15-minute chart. After several attempts to reclaim that zone, the price turned lower, confirming short-term weakness.
At the moment, #ZEC is trading around $495, showing a mild continuation of the bearish structure. The Trendlines with Breaks Oscillator has turned red — a sign of bearish momentum building up, with a confirmed downside break signal.
Key Technical Insights
1️⃣ Chart Pattern
ZEC formed a rising wedge, which typically signals exhaustion after a strong push-up. The breakdown confirms that sellers are gaining control again.
2️⃣ Momentum Shift
The oscillator flipped from green to red, and the signal line crossed below zero, indicating that short-term momentum has shifted bearish.
No bullish divergence has appeared yet, suggesting that the drop isn’t overextended.
3️⃣ Support Zones
🔹 Immediate support: $495–$480 (minor zone)
🔹 Major support: $470–$450, where previous consolidation occurred and buyers may defend again.
4️⃣ Resistance Levels
🔸 $520 – First intraday resistance
🔸 $548 – Key rejection zone & descending trendline resistance
5️⃣ Trend Outlook
While above $470, the market could see short-term bounces. But sustained momentum below this range could open the path toward $450–$430.
If the oscillator flips green again near support, it could mark the start of a short-term rebound phase.
🧠 Summary
Current Trend: Bearish bias, early correction phase
Momentum: Negative, gradually increasing strength
Short-Term Range: $470 – $520
Watch Zone: Reversal signals near $470 for possible long scalps
Conclusion - #ZEC shows early signs of a short-term downtrend, driven by lower highs and bearish momentum confirmation. Traders should watch the Trendlines with Breaks Oscillator closely — a flip to green with rising slope could signal a fresh recovery leg toward $540+.

ZEC MARKET UPDATE💎 ZEC/USDT Analysis – 4H Chart
Zcash is trading inside a well-defined ascending channel, maintaining a sequence of higher highs and higher lows.
Price is currently consolidating near the mid-zone of the channel after facing resistance around $330–$340.
🔍 Market Structure:
• The overall trend remains bullish, but a short-term retracement is possible.
• A move toward the support zone ($227–$187) could provide a fresh buying opportunity.
• If bulls defend this area, ZEC could resume its uptrend toward the supply levels at $410 and $465.
📈 Key Levels:
• Supply Zone: $410 – $465
• Support Zone: $227 – $187
• Mid-Range Resistance: ~$340
⚙️ Trading Plan:
• Buy Zone: $230–$200 (confirmation required)
• Targets: $410 / $465
• Stop Loss: Below $185
• Bias: Bullish continuation after correction
⸻
💬 ZEC continues to respect its bullish channel — watch for a retest of lower support before the next leg up.
📊 #ZEC #Zcash #CryptoAnalysis #TradingView #CryptoCharts #TechnicalAnalysis

ZECUSDT - HOLDING STRONG AMID MARKET WIDE LIQUIDATIONSSymbol - ZECUSDT
CMP - 267.18
ZECUSDT has demonstrated notable resilience amid the broader cryptocurrency market downturn, which triggered over $10 billion in long position liquidations. Even in such an environment, certain assets have managed to withstand the selling pressure.
The cryptocurrency market remains gripped by panic and widespread liquidations, with Bitcoin currently testing the 100K level under intense selling pressure. However, amidst this turmoil, a few altcoins have shown relative strength - ZECUSDT being one of them as it continues to climb and test key resistance zones.
ZEC experienced a sharp decline earlier but found strong demand near the high volume node around 145 - 155. The subsequent aggressive rebound indicates the presence of solid bullish interest at these levels.
Resistance levels: 280.30, 305.65
Support levels: 242.64, 208.76
Focus remains on the 280.20 trigger zone. If the current retest does not result in a deep pullback and price consolidates near resistance, the likelihood of a breakout increases substantially. A decisive close above 280.30 - 280.50 could open the path for a rally toward 305 - 345. That said, it remains a high-risk setup, and traders are advised to exercise caution and maintain tight stoploss.


zcash upcoming rally opportunityhey there everyone today's signal is for
zcash buy some zcash at cmp and laater buy more in the dip
use stoploss at around 50 usdt
have a great trading

💡Don't miss the great buy opportunity in ZECUSD @ElectricCoinCoTrading suggestion:
". There is a possibility of temporary retracement to the suggested support line (152.5).
. if so, traders can set orders based on Price Action and expect to reach short-term targets."
Technical analysis:
. ZECUSD is in a range bound, and the beginning of an uptrend is expected.
. The price is above the 21-Day WEMA, which acts as a dynamic support.
. The RSI is at 53.
Take Profits:
TP1= @ 172.5
TP2= @ 183.9
TP3= @ 199.5
TP4= @ 211.7
TP5= @ 230.1
SL= Break below S2
❤️ If you find this helpful and want more FREE forecasts in TradingView
. . . . . Please show your support back,
. . . . . . . . Hit the 👍 LIKE button,
. . . . . . . . . . Drop some feedback below in the comment!
❤️ Your support is very much 🙏 appreciated!❤️
💎 Want us to help you become a better Forex / Crypto trader?
Now, It's your turn!
Be sure to leave a comment; let us know how you see this opportunity and forecast.
Trade well, ❤️
ForecastCity English Support Team ❤️

💡Don't miss the great buy opportunity in ZECUSD @ElectricCoinCo
Trading suggestion:
". There is a possibility of temporary retracement to the suggested support line (119.0).
. if so, traders can set orders based on Price Action and expect to reach short-term targets."
Technical analysis:
. ZECUSD is in a range bound, and the beginning of an uptrend is expected.
. The price is above the 21-Day WEMA, which acts as a dynamic support.
. The RSI is at 63
Take Profits:
TP1= @ 130.1
TP2= @ 135.1
TP3= @ 143.2
TP4= @ 156.3
TP5= @ 173.8
SL= Break below S2
❤️ If you find this helpful and want more FREE forecasts in TradingView
. . . . . Please show your support back,
. . . . . . . . Hit the 👍 LIKE button,
. . . . . . . . . . Drop some feedback below in the comment!
❤️ Your support is very much 🙏 appreciated! ❤️
💎 Want us to help you become a better Forex / Crypto trader ?
Now, It's your turn !
Be sure to leave a comment; let us know how you see this opportunity and forecast.
Trade well, ❤️
ForecastCity English Support Team ❤️

💡Don't miss the great buy opportunity in ZECUSD @ElectricCoinCoTrading suggestion:
". There is a possibility of temporary retracement to the suggested support line (118.5).
. if so, traders can set orders based on Price Action and expect to reach short-term targets."
Technical analysis:
. ZECUSD is in a range bound, and the beginning of an uptrend is expected.
. The price is above the 21-Day WEMA, which acts as a dynamic support.
. The RSI is at 70.
Take Profits:
TP1= @ 129.4
TP2= @ 134.7
TP3= @ 140.8
TP4= @ 145.5
TP5= @ 150.0
SL= Break below S2
❤️ If you find this helpful and want more FREE forecasts in TradingView
. . . . . Please show your support back,
. . . . . . . . Hit the 👍 LIKE button,
. . . . . . . . . . Drop some feedback below in the comment!
❤️ Your support is very much 🙏 appreciated!❤️
💎 Want us to help you become a better Forex / Crypto trader?
Now, It's your turn!
Be sure to leave a comment; let us know how you see this opportunity and forecast.
Trade well, ❤️
ForecastCity English Support Team ❤️

💡Don't miss the great buy opportunity in ZECUSD @ElectricCoinCoTrading suggestion:
". There is a possibility of temporary retracement to the suggested support line (233.8).
. if so, traders can set orders based on Price Action and expect to reach short-term targets."
Technical analysis:
. ZECUSD is in an uptrend, and the continuation of the uptrend is expected.
. The price is above the 21-Day WEMA, which acts as a dynamic support.
. The RSI is at 62.
Take Profits:
TP1= @ 268.2
TP2= @ 288.3
TP3= @ 345.7
TP4= @ 379.7
TP5= @ 406.4
SL= Break below S2
❤️ If you find this helpful and want more FREE forecasts in TradingView
. . . . . Please show your support back,
. . . . . . . . Hit the 👍 LIKE button,
. . . . . . . . . . Drop some feedback below in the comment!
❤️ Your support is very much 🙏 appreciated!❤️
💎 Want us to help you become a better Forex / Crypto trader?
Now, It's your turn!
Be sure to leave a comment; let us know how you see this opportunity and forecast.
Trade well, ❤️
ForecastCity English Support Team ❤️

ZEC/USDT perfect Cup and Handle pattern Brake outperfect Cup and Handle pattern Brake out in day time frame in ZEC/USDT. Good Moving upside Target 270


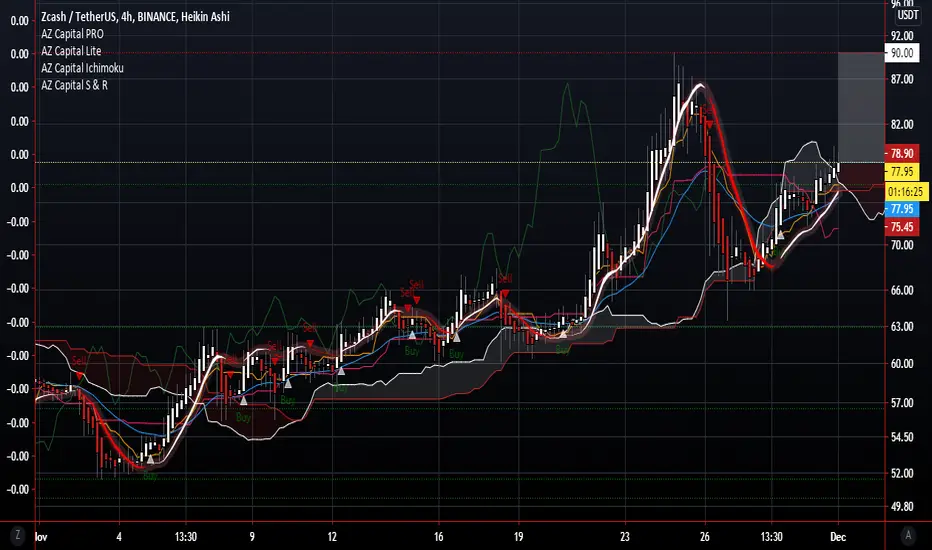
💡 Don't miss the great buy opportunity in Zcash/TetherUSTrading suggestion:
. There is a possibility of temporary retracement to suggested support line (66.27). if so, traders can set orders based on Price Action and expect to reach short-term targets.
Technical analysis:
. Zcash/TetherUS ZECUSDT is in a range bound and the beginning of uptrend is expected.
.The price is above the 21-Day WEMA which acts as a dynamic support.
. The RSI is at 65.
Take Profits:
TP1= @ 75.55
TP2= @ 81.00
TP3= @ 90.00
TP4= @ 94.00
TP5= @ 102.15
SL= Break below S2
❤️ If you find this helpful and want more FREE forecasts in TradingView
. . . . . Please show your support back,
. . . . . . . . Hit the 👍 LIKE button,
. . . . . . . . . . . Drop some feedback below in the comment!
❤️ Your Support is very much 🙏 appreciated! ❤️
💎 Want us to help you become a better Forex trader ?
Now, It's your turn !
Be sure to leave a comment let us know how do you see this opportunity and forecast.
Trade well, ❤️
ForecastCity English Support Team ❤️