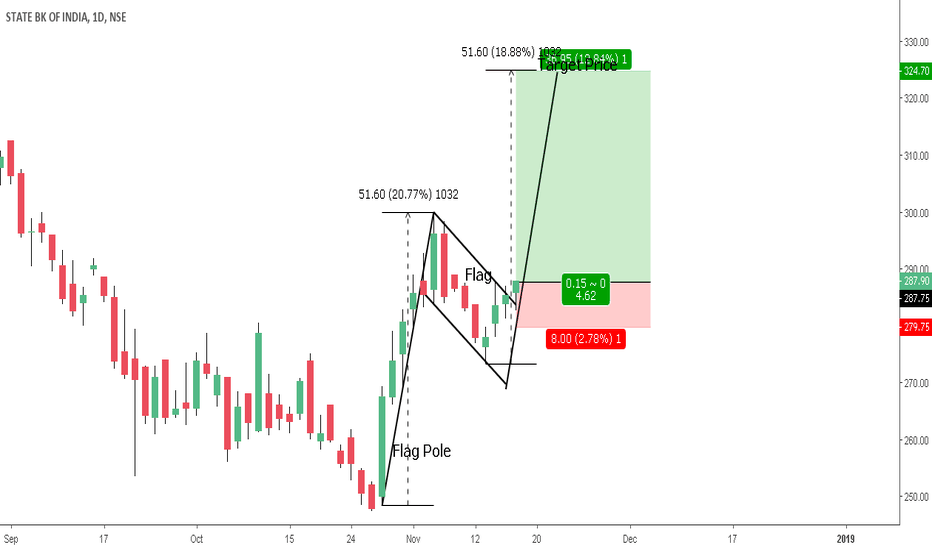
Long sbin Above 288 stop-loss - 279.75 Target 324.70 Risk 2.78 % & Reward 12.84% RR Ratio - 1: 4.62 Continuation Pattern Bullish Flag Bullish Flag chart pattern represents consolidation. This means that it occurs after a large movement in price. As such it’s also a continuation pattern, which means that the market is likely to continue in the same direction...
Short Bajajfinsv Below 5550 Stop-loss: 5745 Target 1: 5160 Target 2: 4955 Risk 3.50% & Reward 10.75 % RR Ratio - 1: 3 RR is Calculated on 2nd Target. Reversal or Continuation Pattern Rising Wedge Prices are moving upward, forming higher highs and higher lows, but the price is confined within two lines which get closer together to create a pattern. This...
Reversal or Continuation Pattern Rising Wedge Prices are moving upward, forming higher highs and higher lows, but the price is confined within two lines which get closer together to create a pattern. This indicates a slowing of momentum and it usually precedes a reversal to the downside. This means that you can look for potential selling opportunities. ...
DALMIASUG Buy at 106-107 Stop-loss: 93.85 Target: 138 Risk 11.50% & Reward 30% RR Ratio 1 : 2.63 Ascending Triangle - Continuation Pattern With its “flat-topped” shape, the ascending triangle indicates that buyers are more aggressive than sellers. The ascending triangle forms because of a supply of shares available at a fixed price. When the supply...
Buy Godrejprop above 620 Stoploss 598 Target 695-750 Risk -3.40% & Reward 12.35% 1 : 3.63 Ratio. RR is calculated on 1st Target. 695
Sell Arvind Below 320 Stop-loss 336 Target 242 Risk 5% & Reward 24.38% RR 1 : 4.88
Buy Havells at 652 Stop loss 638 Target 690 Risk 2.15% Reward 6.07% RR 1 : 2.83
1. ENTRY : Closing Above 1126.70 ( Closing above the Neckline ) 2. Minimum Price Target : 1350 ( Adding the difference between highest high made and lowest low during the formation to The Neckline ) 3. Stop loss : 900 (Usually, price closing below the second bottom is a stop-loss.) Only Problem While treading Double Bottom is it's having a 1:1 Risk...
1. ENTRY : 86.15 ( Closing above the neckline ) 2. Minimum Price Target : 102.80 ( Adding the difference between highest high made and lowest low during the formation to The Neckline ) 3. Stop loss : 70 (Usually, price closing below the second bottom is a stop-loss.)
Reversal or Continuation Pattern Falling Wedge Prices are moving downwards, forming lower highs and lower lows, but the price is confined within two lines which get closer together to create a pattern. This indicates a slowing of momentum and it usually precedes a reversal to the upside. This means that you can look for potential buying opportunities. ...
HCC Entry 15.15 | Stop 13.95 | Target 20 8% Risk | 32% Reward 1: 4 RR Continuation Pattern Bullish Pennant Price highs move slightly lower and price lows move slightly higher. Drawing a trend line connecting price highs and then another connecting price lows form two converging lines which are an identifying feature of the pennant. IDENTIFICATION...
Exit Holding if : Closing Below 78.50 Stop-Loss : 85.80 Minimum Target Price : 53.25 Risk to Reward 1: 3.6 Of course, It's not a trading opportunity as we can not short sell this stock and make a profit. But Those who holding Prajind in their portfolio can exit and enter at a lower level again. It seems convincing enough to sell the stock based on his recent...
Buy Entry 200 - 205 Stop loss 168 Minimum Price Target 248 Risk to Reward 1 : 1.50 24% Up Side potential. The Recent move is supported by Higher Volumes. (Trading volume can help an investor identify momentum in a stock and confirm a trend. If trading volume increases, prices generally move in the same direction.)
ENTRY PRICE : CLOSING ABOVE 1239 STOPLOSS : CLOSING BELOW 1120 MINIMUM TARGET PRICE : 1) 1384 Starting Point of the Downward Slopping Trendline. 2) 1453 Hight of the Pattern. Risk to Reward : 1 : 1.8
ENTRY ABOVE : 424 STOP-LOSS CLOSING BELOW: 402 MINIMUM PRICE TARGET: 460 RISK TO REWARD RATIO : 1 : 1.64
The 200 simple moving average (SMA) is considered a key indicator by traders and market analysts for determining the overall long-term trend. The price level in a market that coincides with the 200 SMA is recognized as a major support when price is above the 200 SMA or resistance when price is below the 200 SMA level. Why is the 200 SMA so common for traders and...
The Symmetrical Triangle The symmetrical triangle (or coil) pattern normally occurs during a trend as a continuation pattern. It is essentially a coin flip as to which direction price will exit if it is truly a Symmetrical Triangle. The triangle includes at least two higher lows and two lower highs. Essentially, the trading range becomes smaller and smaller...
1. The Shape of The Double Bottom – A double bottom occurs when prices form two distinct bottoms on a chart. A double bottom is only complete, however, when prices climb above the highest high point between the two bottoms. The double bottom is a reversal pattern of a downward trend in a stock’s price. Sometimes called a “W” formation because of the pattern it...


