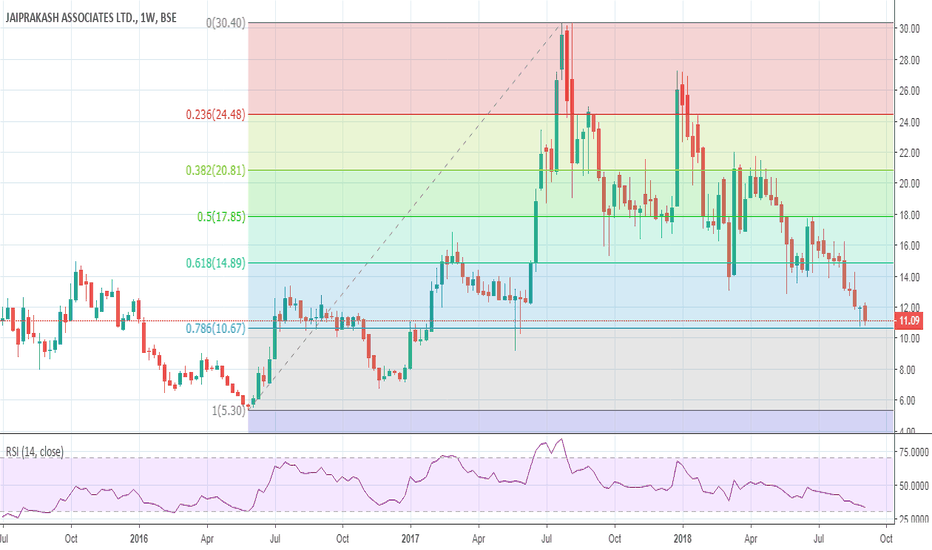
This is a weekly chart of JP Associates. Applied Fibonacci levels to all time low(5.30) and recent highs(30.40). Stock seems to be taking support at 10.85 levels which is also 0.786 of its Fibonacci level. Stock can be sold on a small rally till 11.3 levels with targets of 9.2 Stoploss 11.8. CAREFUL because JPAssociate can be a volatile stock, trading this can...
Applied Fibonacci to recent lows and highs. Stocks is taking support at 0.5 Fibonacci level. Given the weakness in PSU Banks this stock can be sold below 76.3 with a stoploss of 77 Targets of 74.2
Stock is closely following the trend line and up move seems to stall at 780. A break above 780 with volumes is a good buying opportunity with Target of 803 and a breakdown below the trend line which comes around 758 levels may see selling pressure till 745
Applied Fibonacci levels to recent all time highs(1329) and recent lows(1208.5). Stock retraced quite a bit and testing a crucial Fibonacci level of 0.618 which is at 1283. This is very important as it may decide the trend of the stock in near term future and also trend of the market. Right now try buying a put option at low cost at 1280 levels with stoploss of...
This is a 45 minute chart of UBL. Stocks formed a bearish Head and Shoulder pattern at higher levels and broke down. Now its retesting the neckline at 1364 levels which may be a good selling opportunity. Sell UBL at around 1360 with a closing stoploss above 1375 targets can be 1284 and 1256.
As you can see stocks has bee following the trend line and broken below recently. It tried to pullback and failed despite weaker rupee. And it is also creating a bearish head and Shoulder pattern at top which suggest and trend change which may be short term. Sell below 2066 with stoploss of 2085 Target 2025
Applied Fibonacci to alltime highs of 11760 and recent lows of 11393.85 and last week pullback high of 11603. Support lies at above mentioned levels in chart and this correction may feel like it will take us to 11240 levels where there seems to be support emerging. Sell Nifty Stoploss 11500 target 11240.
Applied Fibonacci retracement to Mindtree. Stock seems to be following these levels. Mindtree gave a breakout at 1100 levels a week ago. Given the trend stock could rally further to 1189 and 1214 levels. Buy with a tight stoploss of 1150 and expect 1189 on Mindtree.
Applied Fibonacci retracement. ITC touched its 1.618 retracement at 321 levels and corrected. 100% Fibonacci level is around 296 so expecting correction till 296 and may be uptrend to resume depends on the situation. 296 will be a crucial level to watch out and a nice buying opportunity with good risk reward ratio.
Applied Fibonacci levels to July lows and August highs. Stocks seems to have corrected 50% of its rally and taking support at 289 290 levels which is 0.5 Fibonacci level. It also seems to be following a falling trendline. SBI can be a sell below 288 with a stoploss of 293. Target is 280.
Stock seems to be breaking a long term trend line as drawn in the above chart which suggests more selling could come. But its also seems to be taking support at 784 levels so either wait for a retest of the above broken trend line to sell or a breakdown below 780 levels. Any breakdown below 780 levels with a strong close below that level may signal correction upto...
Stocks seem to be making a round bottom formation over the year and breaking out of this pattern. Buy with a stoploss of 671 Target of 409 718. Longterm targets are 940.
US markets mat be at a near term support. Closing below the trend line may trigger a correction but right now it looks ti be safe.
PSU Banks have been in a consistent downtrend since the rally they had after 2008 Financial crisis. This charts looks at last 10 years for PSU bank index and they seem to be following the trend line. index needs to have strong consecutive weekly close above 3350 for a major uptrend to start until then its a sell on rally. We should wait for Index to close below...
Titan may be making a Bearish Head and shoulder pattern on yearly charts. 940 being the shoulders and 990 levels is the Head. We should wait for confirmation which a closing below 800 levels for 2 consecutive days. After confirmation targets mat be 760 740 levels and may be more.
This chart looks at the DAX index from Germany. It may be creating a Bearish Head&Shoulder topping pattern at at 13500. 2 day consecutive closing below the neckline of 11950 should be a confirmation. We must wait and see.
Auto Stocks may be at a crucial level. Index has been creating a falling wedge pattern closely following the mentioned trend line. A weekly close below the red line may be bearish and targets upto 9920 levels. Similarly weekly closing above the falling trend line may signal uptrend till previous highs. Lot depends on news flow and earnings so lets see...
This is a short pull back but correction may resume till 11350 levels in this week.


