such stable chart. shows how solid its roots are and that management was always serious regarding growth and rewarding all its investors. a possible breakout if confirmed ll set its path for 1300-1400 . i think its coming
a rebound from very crucial level.. 235 is a support zone.. if sustains , it could head towards 300 + in coming days.
in continuation to what i had twitted earlier , here is the thing. if not negated, we have a massive move coming up !!
The bull is unleashed. all it requires is market support. 600 could be on its way in short term. !!
update to what i had shared last. here it is on the edge. can go to sub 7500 levels if doesnt recover.
Isnt that a great symmetry.. looks likes a mirror image although people might look at shape , but similarity is more imp here. Also note the movements of the two mov avg. though its said that diamond like formation is often the top, lets see if it actually tops out. again whats an universal obvious will not happen but lets not overhead any obvious situation.
although i dont have any position, i might wanna think of contra bet. risk is risk afterall. immediate Resistance 225-230 then 250-260. Immediate support 195-200. a small one around 210. todays volume was decent. lets see how it goes.
why divergence works. here is an example. also if hns is continuation ll soon se a reversal. if not , then 110 could be seen going ahead.
a clear breakout with good volumes.. perhaps one can go long this or next week if one wants to let things stabilize..
will we see a possible reversal from 50% retracement !! thats a inverted C&H and its failure will result into 4K levels !!! to be seen
from my previous chart, here is an update. My trading sl 650 ! .. crucial this and next week to see its movement..
favorable RRR if in zone 100-125 or below. soon ll give an buying option although it can reverse from anywhere (may be sooner). no position for now. long is the way to go.
Thats why i say fall from double top is always a shorting opportunity. especially for fno people. levels are quite clear where are we heading to. though always look for an reversal but this will take long time !! a hard retest of black line (a continuation hns) could jerk up things. yet i might still look for more downside. do not trade basis this. self study is...
The weekly chart. Almost on the trend line that starts all the way back !! 2 divergences of smaller magnitude !! i think its in to consolidation zone where accumulation happens. this in turn would imply a longer period of such movement. !! on my radar.
Everyone's favorite , last time this corrected upto 50% retracement. now fallen off a double top, i think it will correct more. huge gap to be filled , lets see if it takes this in style.
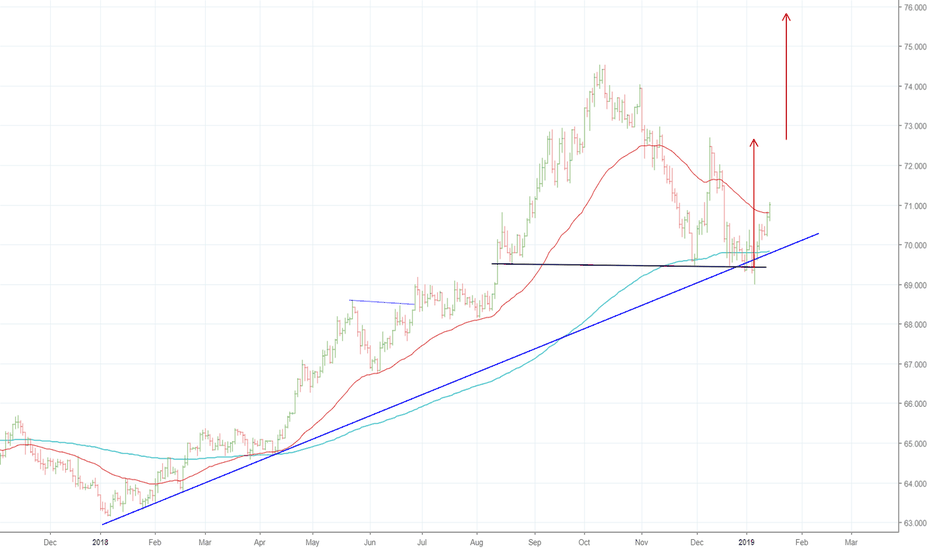
If you guess what pattern it is , you are on right track ! the debate could be who sees what , but perhaps conclusion should be the same.. 75.85 - 76 is coming , probably in q or 2 !!
in continuation to my last published chart, here is what all has happened since then.. now facing stiff resistance and in that zone , its worthwhile to see how it behaves. candles say there could be some southward journey while sentiments say time to go up yet again.. we will see
A point where i can look for bear trap is 216-17 ! if a clear breakout then we are heading higher but less chance. the megaphone (small) could still insist of touching lower end of the channel after this good run. this is simple and clear !!


