deepakequities
Technically - Strong Fundamentally - Undervalued (Price to book value 1.14 and other ratios indicates the potential) News in Favour : DCM Nouvelle Specialty Chemicals Limited (DCMSCL), completed the Commissioning of Chemical plant situated at DMIC Vikram Udyogpuri Limited, Plot No 91, 92, 93, Industrial Township DMIC Vikram Udyogpuri, Village Narvar, Ujjain,...
Only for Educational Purpose Nifty forms Cup & Handle Pattern (Bullish).
NSE:SPARC Only for Educational Purpose. Do your own research or consult experts before investing
As per Technical NIFTY 50 forms Bullish Cup & Handle Pattern in weekly chart. By June 2024 it may achieve its 21000 milestone. Fundamentals looks good when compare with other countries like US,China etc...India's GDP may grow at a good pace even 2 times higher than US and other nations. Due to elections retail investors will panic but FII will soon be a buyers in...
NIFTY 50 in Daily Charts forms Inverse Cup & Handle pattern which indicates upcoming bearish breakout.RSI 14 @ 48 and trending down indicates weak RSI.In DMI, ADX indicating that current uptrend is weak and preparing for steep fall upto 14000 levels. In Ichimoku Kinko Hyo price still below cloud and Conversion line not in a position to cross above Base Line.
BHARTIARTL Forms Head & Shoulders Pattern an completed its breakout. In Ichimoku price breaks below cloud.13 MA crossed below 21 MA. RSI trending down
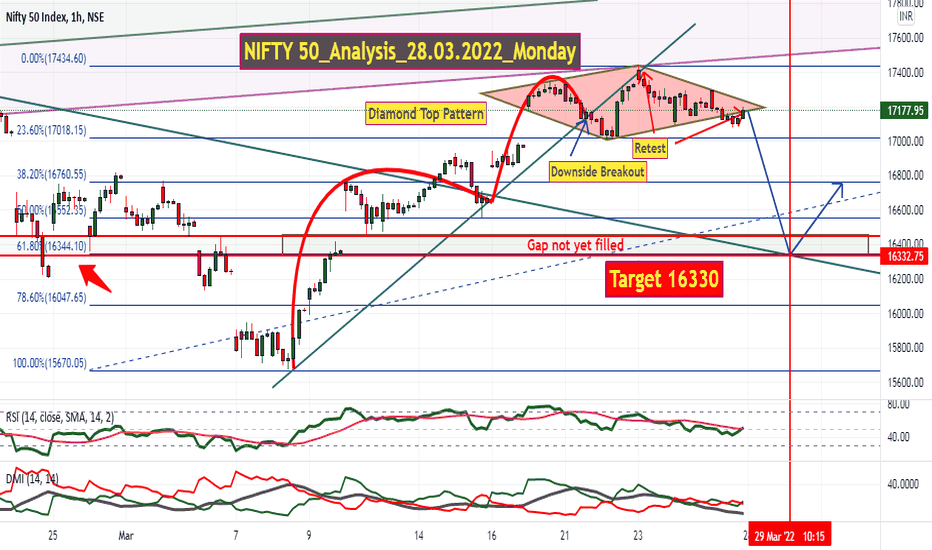
Technical : NIFTY forms Inverse Cup & Handle Pattern and Completed its downside breakout and retest followed by Diamond Top Pattern in 1 Hour Time Frame for the Target of 16700 and then the next target for Inverse Cup & Handle will be 16330. In my view before March 31st or within April 1st week this target looks Possible. RSI @ 50 not indicating as buying zone, in...
Details mentioned in chart Disclaimer : Kindly understand after deep study by your own and then come into conclusion. This is my view only not a recommendation for all. Please analyse by your own or consult your financial advisor before taking any decision.
Details In Chart Disclaimer : Educational Purpose Only. Please Do Your Own Analysis Or Consult Your Financial Advisor Before Taking Any Decision
* NIFTY right now at Elliot's Correction Wave * NIFTY may see a huge correction as per Elliot wave * Whenever the chart patterns looks difficult to predict the upcoming trend Elliot wave will be used * Below 16300 NIFTY may turn into extreme bearish mode * Price crossed below 20 SMA but unable to break above 20 SMA from below and may take support...
SHORT BELOW 490 SL 510 TGT 456/409 * Support @ 495/456/409 & Resistance @ 532/577/607 * 20 DMA breaks 100 DMA and 50 DMA * 20 DMA breaches 200 DMA but support is there @ 495, once the support will be broken then the next minor support @ 456 & major support @ 409 * RSI 14 @ 41.60 (H-84.34 L-23.76) RSI 9 @ 30.93 (H-76.65 L-41.52) * ADX @ 43.78...
Synopsis : NIFTY forms Inverse Flag Pattern, it is a sign of bearish momentum. At first forms Head & Shoulders Pattern and then Inverse Flag Pattern, and now again forms the same Inverse Flag Pattern. And also as per Fibonacci Levels Target comes around 15720-750. Price breaks 20,50,100 SMA's.But 200 SMA not yet broken as it is @ 16230-250 levels. Also RSI...
NIFTY looks bearish in short term : * NIFTY forms Head & Shoulders Pattern and completed its breakout * As per Fibonacci Levels may come down to 16650 levels * Price breaches lower Bollinger band and may continue to go down as a band walk * Price crosses below 20 & 50 DMAs and may take support in 100 DMA but will not sustain
Nifty Forming Pennant Pattern slowly but breakout not yet done. After Breakout there may be some pullback and the Target. Its a long journey but good for investors in SIP Mode or even for Lump sum investors at this time. Kindly View my Previous post in the the below link. I post NIFTY 50 analysis with a target of 18000 in Feb'22 but that achieved even before.
All details in chart.Monthly & Weekly breakout in Kalyani Forge. And also pullback almost over.Seems like good gradual increasing stock for long term. Invest in SIP mode or buy on dips to get your investment near to double.
Details in chart. HINDUNILVR closed bearish but it takes important weekly support. Not only this some other FMCG stocks also taken weekly support
SUNPHARMA looks bullish till 937 levels but before that as a pullback it may test 803 levels and again go up till 862 which will be the first target and then after some retest it may again shoot up and may touch 937-940 levels
Details in Chart


