Indusind bank is at good level , in the coming weeks it can go to 1100 + levels.
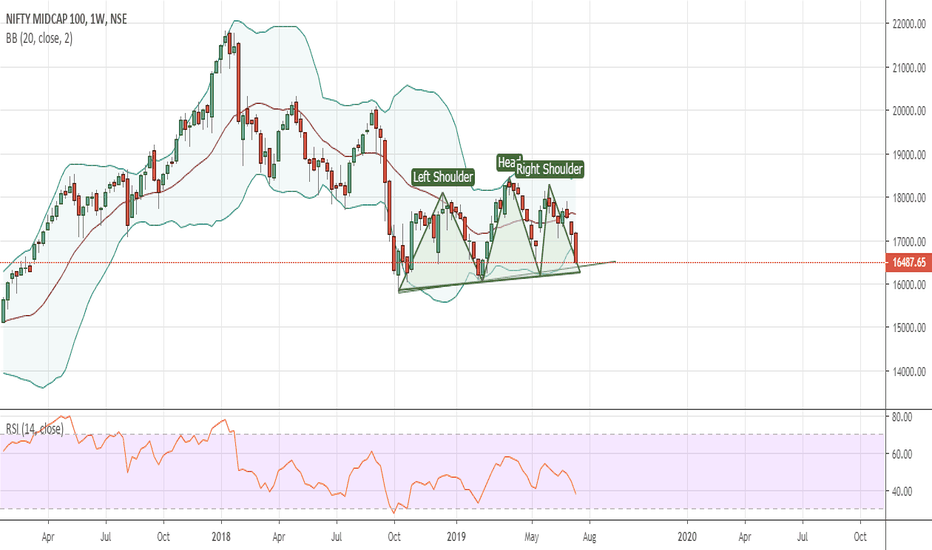
There is a Head and shoulder setup on Cnxmidcap weekly chart. The neckline is forming around 16000 - 16300 zone. It should not breach that level and give weekly close below than that. Otherwise it will open up 2000 points downward space. Ofcourse Midcap index is not trade-able directly. However many people are routing their money through SIPs in many Midcap funds.
Raymond has been providing very good risk to reward trade setups. First it completed bearish Bat and now it can provide good opportunity for Bullish Cypher pattern. Sl would be slightly below 800. Targets 840, 880. Flag pattern is also visible in the Raymond's chart.
SBIN is approaching towards weekly support zone. Buying zone 255 - 259 . SL below 247 Targets 275, 290.
We have potential Bearish Gartley on Ibulhsgfin daily chart. Potential reversal zone 1325 - 1350 zone. Stop loss - There is falling trend line connecting lower highs. Any break out above that level could be a good buying opportunity. Targets - 1272, 1240
Last week Nifty had a classic doji on weekly chart. It failed to cross previous week's high of 10078 levels. Banknifty also created Doji candle on weekly chart. (However it crossed previous week's high by few points!) Trade set up - Short positions can be created with the stop loss of 10080 - 11000 levels. Fresh longs can only be initiated only above the given...
We have witnessed Banknifty taking a breakout from the downward channel. Below are some trade setups possibilities. 1. Banknifty will reverse from previous move's retracement levels like 0.54, 0.618, 0.74 or 0.786 (shown on the chart). Take trade only after confirming the reversal signal. Please also note the downward trendline of lower highs on daily chart. 2....
We have potential Bearish Gartley pattern in Banknifty. Create short positions on confirmation of the reversal. Potential reversal area 26850 to 26980. Stop loss slightly above 27000. Targets - 26500, 26300 perhaps more than that. I am posting Germany's DAX index chart for the reference where Bearish Bat pattern is executing perfectly.
I will try to explain my view which I have drawn on chart. Nifty made a low near 10276 and bounced from channel support and went up till around 10600. However so far it's looking like a temporary bounce as Nifty is not able to sustain at heights. This time if Nifty will go down from current levels it will breach 10276 level and can land between 10000 to 10100...
326- 330 is the supply zone and good entry level for creating long position. Risk reward ratio becomes favorable in that zone. Kindly note that Vedl will declare it's quarter result on 2nd November so volatility may increase on that day. Targets can be 340, 345, 350.
Icici bank is approaching near weekly support. It has retraced 0.618 of previous up swing at around 269. It has not made a new weekly low after that , however it has not crossed previous week's high. One can create a positional trade entry with the stop loss of 265 where channel support is placed. Safe traders can enter once it crosses above 282.
Concor has taken a break out as shown in the weekly chart. Buy only above 1267 for the targets of 1350 and 1480. Once the buy is initiated stop loss can be set as 1235.
- Nifty has broken the hourly uprising channel as shown as point 1 in the chart. (Also observe the daily candle of 4th August, it has made lower low and lower high). - Whenever the channel brakes, price action tries to touch the previous channel support ( Point 2 in the chart) - I am expecting resistance between the zone 10080 - 10100 as previous support will...
Few observations on Tatasteel weekly chart. 1. TS is moving in an upward weekly channel and gave a rejection at channel resistance. 2. It has a made a high near 572 , where weekly resistance zone is around 570 - 575 level. 3. It is forming a spinning top candle on July month's candle. Although 31st July close needs to be checked for that :) - Quarter results are...
After couple of Doji candles finally we have bullish signal at the channel support in the weekly chart of BHEL. Even if we check monthly chart BHEL has negated the downfall with the Doji candle. It's a positional trade. We are witnessing short covering in many PSUs, let's see if BHEL stands a chance. Small targets 145, 150 it can go further. SL 135.
IMFA is an investment cadre stock. It is forming Cup and Handle pattern. Handle break out has occurred at 61.8% swing retracement. If the pattern is correct and we measure the target it can give roughly 700 points from the handle break-out. Target comes around 1100 level. Kindly confirm at your end before investing your valuable money.
Bajaj_auto has taken support at 2750 for multiple times. This time with double bottom and a hammer on a daily candle. Target 1 - 2825 Target 2 - 2850 ( It can go higher too). Sl - 2749
We can expect a reversal in BPCL between the zone 644 - 658. It can be a good opportunity for positional long trade. Please wait for the reversal candle on a daily basis before initiating the trade. I will update on confirming the reversal.


