shivashish876
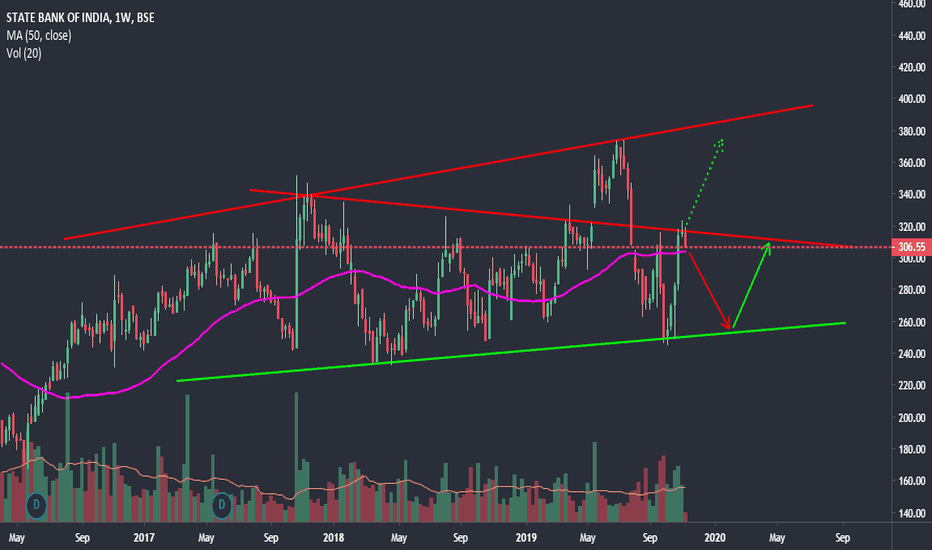
NSE:SBIN SBI chart analysis. We can see a correction till 256 levels from there it will bounce again taking support from the base line. If it closes above 324 we can see a target of 370+ achievable.
NSE:PETRONET Petronet is moving in the ascending wedge pattern, respecting the lower base of the wedge, every time it touches, it bounces up from it. It has done that 4 times now. As it has broken the upper base of the wedge pattern and closed below it after days of consolidation. It seems that, it will correct till 277 level taking support of the 50%...
NSE:ICICIPRULI This stock is continuously making higher highs and now it has breached the upper band of the wedge pattern. It has good support level of 525/513. One can keep on accumulating it at every correction. SL 504 closing.
NSE:HINDUNILVR HUL is moving in an ascending wedge pattern, which has already tested lower levels 4 times thus, acting as a major support. On the upper side it has tested the upper band 3 times, and again showing correction - genuine to this pattern. Safe investors can wait till it reaches the lower base and then make a Long position so that we can ride the...
NSE:TCS TCS is forming a wedge pattern, it has taken support from the lower base ans is rising towards the upper band of the wedge. we can look for entry level at any correction for Long position.
NSE:RELIANCE the stock is testing the upper band on the flag pattern. once it closes above that we can see a positive rally upside.
Dear friends, Jet has taken a nose dive from the 883lvl of high since 01/2018. On monthly chart it has broken all the major Fibonacci levels, still we can have a possible support and bounce from the 270lvl. May Jet fly again :)
Dear friends, The stock had a good positive rally since 186lvl (11/2016) till 390lvl (08/2018) forming the pole of the pattern. Since reaching the high of 390lvl it has corrected and has found support on near 280lvl (Fibonacci 50%). It has broken & closed above the Fibonacci 38.20%lvl giving a confirmation of the trend continuation. We can enter in range of...
Dear traders, Since its listing in 2017 RNAM has corrected substantially after achieving a high of 335. Finally I see a break in the trend by the strong bullish candle on 24/7. It has continued to make higher high since then. We can look for a Long opportunity if it breaks and closes above 272.40 (higher than Fibonacci 50%) with immediate support at 255 lvl...
Dear friends, finally Manappuram has broken its negative H&S pattern on daily charts with a strong bullish candle after nearly 2 months of of consolidation. I believe gradually it will rise up to the 120+ level. The red supply line will now serve as the support line.
Axis Bank has taken support on the positive trend line proving to be the demand zone. we can go long at CMP ~530 for a target of 546+. Please do your analysis before investing. This view is for educational purpose only


