Bitcoin Cash price is up by 2.65% on Saturday's trading session. The price is consolidating for now and can see no signs of positive retracement during the session. So the trend remains negative price may fall till the support zone of 409.50 Resistance: $547.00 Support: $409.50
Polkadot current price is up by 8.65% on Saturday's trading session. The price is struggling to break out from the resistance of $18.45. If it breaks and sustains above the resistance, one can further expect a bullish trend in the coin till the next resistance level of $20.89. Resistance: $18.45, $20.89 Support: $10.59
XTZ price is up by 9.80% on Saturday's trading session. XTZ breakout from the falling channel pattern forming a bullish momentum. One can further expect a bullish trend in the coin to the resistance level of $3.40 in upcoming trading sessions. Resistance: $3.40 Support: $2.44
Litecoin price is down by 6.04% on Friday's trading session. The price is below 20 and 50 days EMA, and it can move towards the support level of $118.94. One can further expect a short term recovery in the coin for a while, and then it can be bearish in the upcoming trading session. Resistance: $166.21 Support: $118.94
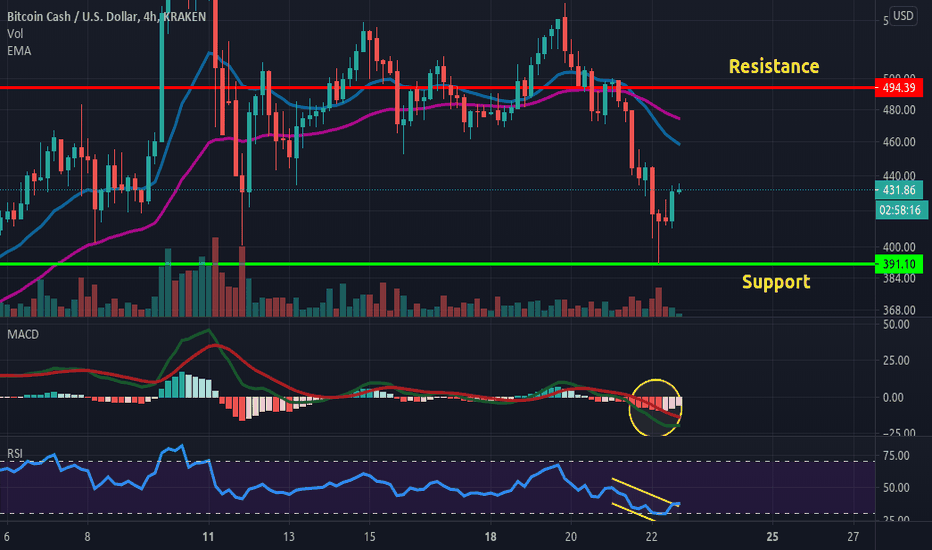
Bitcoin Cash Value is down by 7.42% on Friday's trading session. The price is below 20 and 50 days EMA, and it can move towards the support level of $391. One can further expect a short term recovery in the coin for a while, and then it can be bearish in the upcoming trading session. Resistance: $494.39 Support: $391.10
Polkadot coin price is up by 0.74% on Friday's trading session. The price may consolidate for a while. If it sustains above both the EMA, it can move towards the resistance, and one can further expect a bullish trend in the coin till the resistance level of $18.24. Resistance: $18.24 Support: $10.56
Ether current price is down by 2.14% on Friday's trading session. The price is below both the EMA may recover for a while till the 20 EMA of $1243.13. If it sustains above both the EMA, it can move towards the resistance, and one can further expect a bullish trend in the coin till the resistance level of $1324.16, but if it slips below it may fall towards the...
Polkadot coin price is down by 8.18% on Thursday's trading session. The price may soon move towards the resistance level of $18.24. If it sustains above the resistance, one can further expect a bullish trend in the coin. Resistance: $18.24 Support: $14.77
Litecoin price is down by 5.62% on Thursday's trading session. The Price can soon slip down from the support level of $141.66. If it sustains below the support, one can further expect a continued bearish trend till the next support of $122.25. Resistance: $148.35 Support: $141.66, $122.25
Chainlink coin price is down by 1.59% on Thursday's trading session. The price may plunge towards the support level of $18.10. If it sustains below the support, one can further expect a continued bearish trend in the coin. Resistance: $22.83 Support: $18.10
Cardano price is down by 5.05% on Thursday's trading session. It may plunge towards the support level of $0.3287. If it sustains below the support, one can further expect a continued bearish trend in the coin. Resistance: $0.3835 Support: $0.3287
Bitcoin SV is in the bearish trend for now, below the resistance level of $198.56. All technical indicators suggest a sell signal in Bitcoin SV coin price. If it breaks down the support level of $191.44, we can see another fall from here till the next support of $184.47. Resistance: $198.56 Support: $191.44, $184.47
OMG coin gave a breakdown few days back and approached to another intersection point of support and resistance. There is a tough fight between the bulls and bears. Know more at the under given link
XTZ price is in a negative trend. Price levels face retracement from the resistance level of 122.02. One can further expect a bearish trend until the support level of $103.71. Resistance: $122.02 Support: $103.71
XTZ price is in a positive trend. The price is above 50 and 200 days, EMA. One can further expect a bullish trend until the resistance level of $2.88. Resistance: $2.88 Support: $2.18
The technical chart highlights the significant retracement faced by Litecoin price levels forcing it to test the baseline of the retracement table. The levels did have a positive bounceback but currently facing resistance at 0.5fib level. A positive breakout in the form of candle closing above the resistance line can be a confirmed bullish indication for the...
The technical chart of Cardano reflects on the strong positive bounceback made by the price levels after testing the critical support line of 0.618fib level. With the help of positive sentiments emerging in the overall market conditions from the past couple of trading sessions, the price levels were able to have a positive breakout above the resistance line placed...
Litecoin (LTC) market price is in a downtrend and struggles between multiple support zones. The price is below 50 days, EMA and 200 days, EMA. One can further expect a bullish trend if it sustains above the EMA and support zones; the price can move towards the resistance level of $168.15. Resistance: $168.15 Support: $145.10, $138.24, $126.40


