OMG tokenThis token doesnt have a stop loss , just go on averaging as the price falls , The target given is easily achieavable .
Key stats

OMG Coin Preparing for a Takeoff or another crash?OMG coin gave a breakdown few days back and approached to another intersection point of support and resistance. There is a tough fight between the bulls and bears. Know more at the under given link

OMG Network Live Price Heading Toward Critical Resistance ZoneThe technical chart of OMG Network highlights the significant retracement faced by the price levels after touching the critical resistance area of $5.00. The price levels went straight down to the critical support area of $2.50 resulting in almost 50% retracement. The support level did provide a pos

Don't miss the great buy opportunity in OMGUSDTrading suggestion:
. There is a possibility of temporary retracement to suggested support line (1.5200). if so, traders can set orders based on Price Action and expect to reach short-term targets.
Technical analysis:
. OMGUSD is in a range bound and the beginning of uptrend is expected.

Don't miss the great buy opportunity in OMGUSDTrading suggestion:
. There is a possibility of temporary retracement to suggested support line (1.6065). if so, traders can set orders based on Price Action and expect to reach short-term targets.
Technical analysis:
. OMGUSD is in a range bound and the beginning of uptrend is expected.
.Th


There is a possibility for the beginning of an uptrend in OMGUSDTechnical analysis:
. OMISEGO/DOLLAR is in a range bound and the beginning of uptrend is expected.
. The price is below the 21-Day WEMA which acts as a dynamic resistance.
. The RSI is at 41.
Trading suggestion:
. There is a possibility of temporary retracement to suggested support zone (7.

OMG/USD:Falling Wedge+Support+Bull DivThere is Bull Div on daily and a Falling wedge and order block right below. A upmove is soon expected
TGT: 9.6
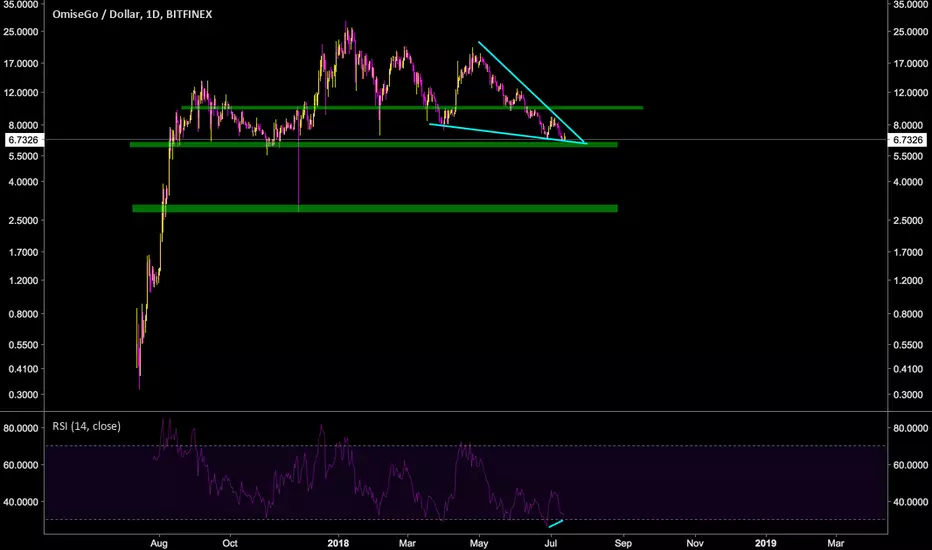
There is possibility for the beginning of uptrend in OMGUSD Technical analysis:
. OMISEGO/DOLLAR is in a downtrend and the beginning of uptrend is expected.
. The price is below the 21-Day WEMA which acts as a dynamic resistance.
. The RSI is at 41.
. The RSI downtrend & The price downtrend in the daily chart are broken, so the probability of resumpti

There is a possibility for the beginning of uptrend in OmiseGoTechnical analysis:
.OMISEGO/DOLLAR is in a Range Bound and Beginning of up trend is expected.
.The price is below the 21-Day WEMA which acts as a dynamic resistance.
.The RSI is at 38.
Trading suggestion:
There is a possibility of temporary retracement to suggested support zone (12.50 to 1

See all ideas
Displays a symbol's price movements over previous years to identify recurring trends.
Curated watchlists where OMGUSD is featured.

Frequently Asked Questions
OMG Network (OMG) reached its highest price on Jan 8, 2018 — it amounted to 28.5000 USD. Find more insights on the OMG price chart.
See the list of crypto gainers and choose what best fits your strategy.
See the list of crypto gainers and choose what best fits your strategy.
OMG Network (OMG) reached the lowest price of 0.1790 USD on Sep 6, 2024. View more OMG Network dynamics on the price chart.
See the list of crypto losers to find unexpected opportunities.
See the list of crypto losers to find unexpected opportunities.
The safest choice when buying OMG is to go to a well-known crypto exchange. Some of the popular names are Binance, Coinbase, Kraken. But you'll have to find a reliable broker and create an account first. You can trade OMG right from TradingView charts — just choose a broker and connect to your account.
You can discuss OMG Network (OMG) with other users in our public chats, Minds or in the comments to Ideas.