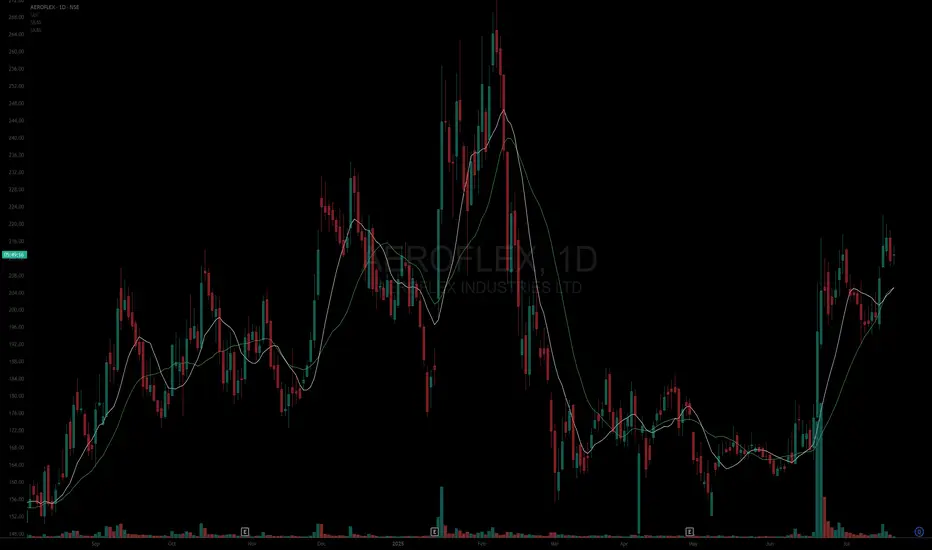
Asset: Aeroflex Industries Ltd (AEROFLEX)
Breakout Level: 215
Potential Target: 272
Stop Loss: 205 (~4%)
Timeframe: Short to Medium term
Risk to Reward ratio : 1:6
Rationale:
Fundamentals -
Fundamentally decent stock with the following attributes:
* ROCE - 22.3%
* ROE - 16.6%
* Debt to Equity - 0
* Stock PE 52.2 / Industry PE - 25.5 || Stock PBV 8 / Industry PBV 2.43 - Company is overpriced
* EPS / Revenue - Increasing
Technicals -
* HVE edge carry over, the stock is now showing tight price and volume action
* Price is surfing the 10/20 DMA
* 200 DMA is forming a slightly increasing structure
* Multiple timeframe analysis - Not much to be gathered from monthly charts however weekly charts are showing consolidation as well
* RS is increasing
* ADR 4.2%
Market analysis
* Forecasted for ~33% further increase
* Promoter holding at 67% and remains steady
* MFs are increasing their holding
Cons
* Momentum is slow holding patterns are not that ideal
This analysis is for educational purposes only and should not be considered as financial advice. Trading and investing in financial markets involve significant risk, and past performance is not indicative of future results. You should conduct your own research and consult with a qualified financial advisor before making any trading or investment decisions. The author is not responsible for any financial losses or damages that may result from the use of this information.
Disclaimer
The information and publications are not meant to be, and do not constitute, financial, investment, trading, or other types of advice or recommendations supplied or endorsed by TradingView. Read more in the Terms of Use.
Disclaimer
The information and publications are not meant to be, and do not constitute, financial, investment, trading, or other types of advice or recommendations supplied or endorsed by TradingView. Read more in the Terms of Use.