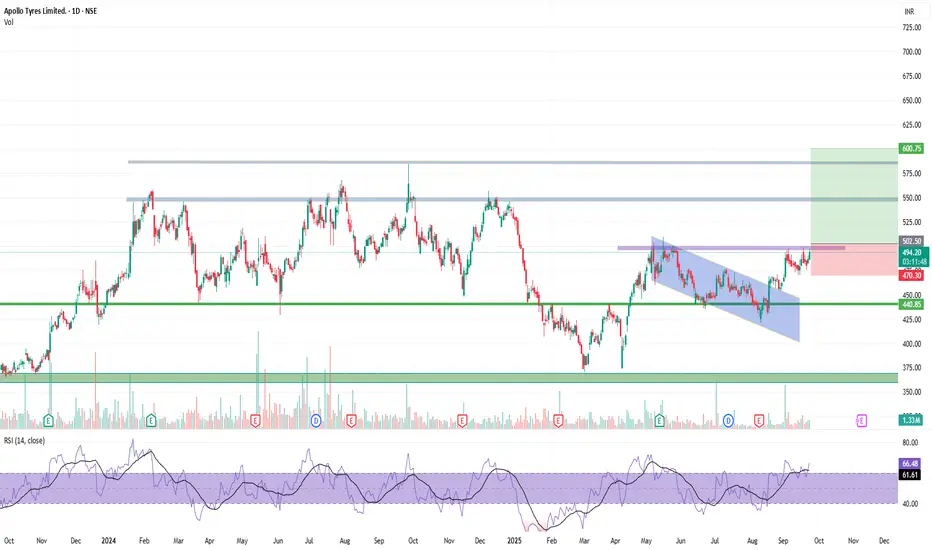
📈 Trade Idea: Apollo Tyres (NSE: APOLLOTYRE)
Chart Setup
Pattern: Breakout from a falling channel (bullish reversal structure).
Current Price: ₹493.35
Support Zone: ₹440 – ₹450 (strong historical demand zone).
Resistance Zone: ₹500 – ₹525 (short-term supply).
Indicators: RSI near 66, showing bullish momentum but not yet overbought.
📊 Trade Plan
Entry Zone: Around ₹490 – ₹495 (current breakout retest).
Stop Loss: Below ₹475.55 (recent swing low & invalidation level).
Target 1: ₹525 (intermediate resistance).
Target 2: ₹600+ (major resistance & measured move from channel breakout).
⚖️ Risk–Reward Setup
Risk (SL): ~₹18 per share.
Reward (Target 2): ~₹107 per share.
Risk:Reward Ratio: ~1:6 (favorable).
📌 Technical View
Breakout from descending channel with volume confirmation.
Price holding above 200-day EMA.
RSI momentum bullish, still room to move higher.
Strong demand zones protecting downside risk.
Disclaimer
The information and publications are not meant to be, and do not constitute, financial, investment, trading, or other types of advice or recommendations supplied or endorsed by TradingView. Read more in the Terms of Use.
Disclaimer
The information and publications are not meant to be, and do not constitute, financial, investment, trading, or other types of advice or recommendations supplied or endorsed by TradingView. Read more in the Terms of Use.
