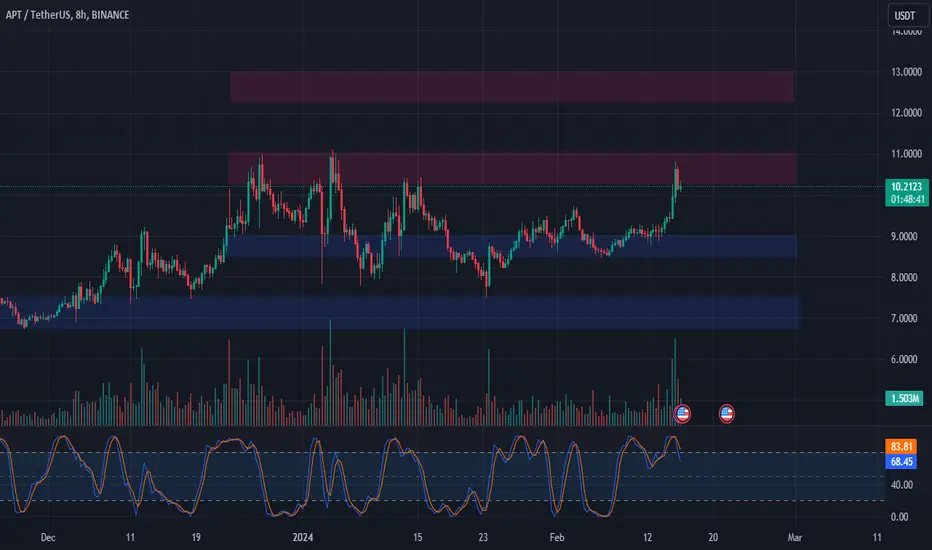
📊 Technical Overview:
APT: Testing resistance at $10.30 - $11.00.
Key Levels: $10.30, $11.00, $9.00, $12.30, $13.00.
📉📈 Trade Analysis:
Resistance Test: APT testing the resistance area.
Overbought: Overbought on the 8-hour chart.
Support Levels: Potential support at $9.00.
Long Trade Plan: Consider entering a long trade if $9.00 holds.
Profit Targets: $10.30 - $11.00, $12.30 - $13.00.
Potential Gain: Roughly a 45% gain from $9.00 to $13.00.
Stop Loss: Below $8.50.
🚀🔄 Note: Monitor price action around $9.00 and adjust trade strategy accordingly. 📊💡 #APT #TradeAnalysis #StockMarket 📈📉
Disclaimer
The information and publications are not meant to be, and do not constitute, financial, investment, trading, or other types of advice or recommendations supplied or endorsed by TradingView. Read more in the Terms of Use.
Disclaimer
The information and publications are not meant to be, and do not constitute, financial, investment, trading, or other types of advice or recommendations supplied or endorsed by TradingView. Read more in the Terms of Use.