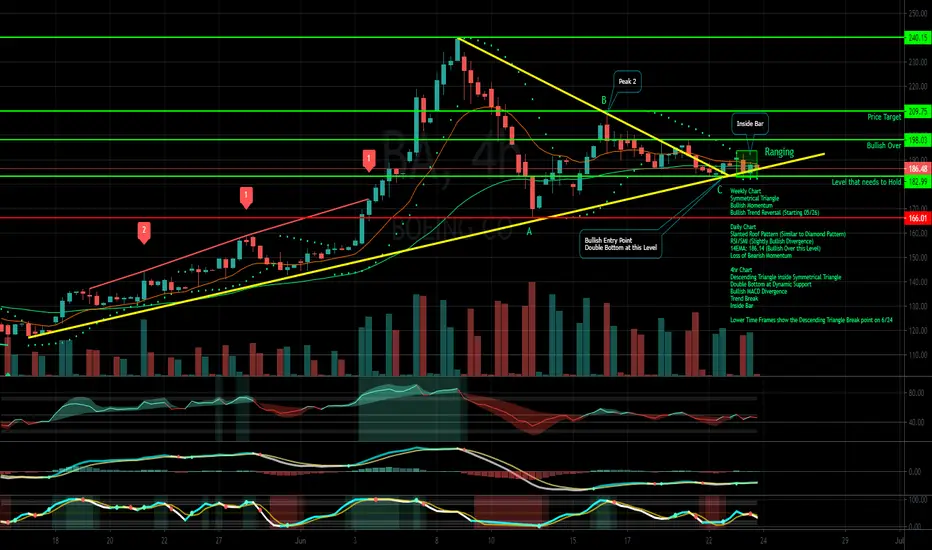
Weekly Chart
Symmetrical Triangle
Bullish Momentum
Bullish Trend Reversal (Starting 05/26)
Daily Chart
Slanted Roof Pattern (Similar to Diamond Pattern)
RSI/SMI (Slightly Bullish Divergence)
14EMA: 186.14 (Bullish Over this Level)
Loss of Bearish Momentum
4hr Chart
Descending Triangle inside Symmetrical Triangle
Double Bottom at Dynamic Support
Bullish MACD Divergence
Trend Break
Inside Bar
Lower Time Frames show the Descending Triangle Break point on 6/24
Disclaimer
The information and publications are not meant to be, and do not constitute, financial, investment, trading, or other types of advice or recommendations supplied or endorsed by TradingView. Read more in the Terms of Use.
Disclaimer
The information and publications are not meant to be, and do not constitute, financial, investment, trading, or other types of advice or recommendations supplied or endorsed by TradingView. Read more in the Terms of Use.