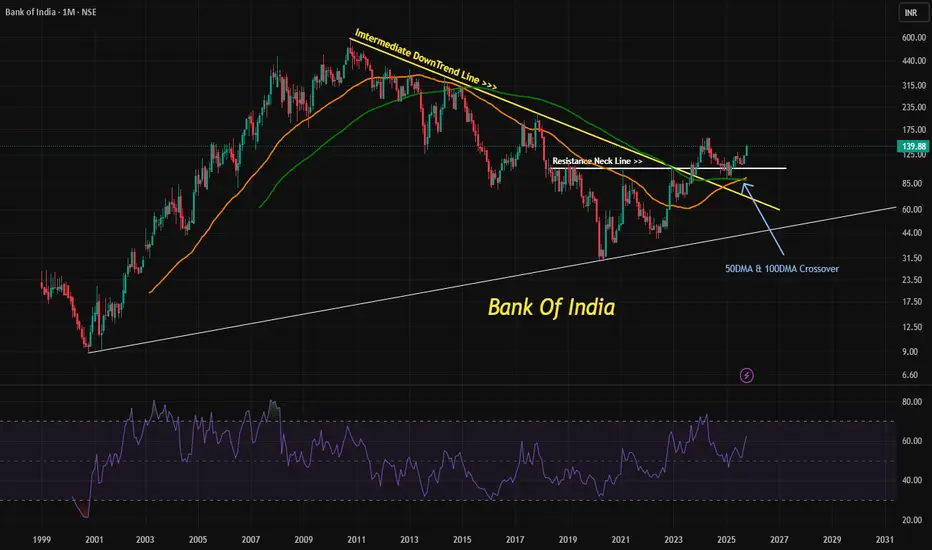
Bank of India (NSE: BANKINDIA) is currently trading at ₹139.88 and presents a technically strong setup for bullish trend continuation. A closer look at the monthly chart reveals several key developments that reinforce this outlook.
🔍 Technical Highlights
✅ Intermediate Downtrend Reversal
The stock has completed an intermediate downtrend reversal, marked by a higher high at ₹107.00. This level sits above the neckline of the previous consolidation pattern, confirming a shift in momentum and signaling renewed strength in the trend.
📊 Moving Average Alignment
Price action is currently above both the 50-day and 100-day moving averages. This positioning reflects underlying bullish sentiment and sustained buying interest. Moreover, the 50 DMA has crossed above the 100 DMA—a classic bullish crossover that often precedes further upward movement.
📈 Long-Term Uptrend Intact
The broader trend remains upward, supported by consistent higher lows and higher highs. The recent price behavior aligns with this long-term trajectory, suggesting that the stock is well-positioned for continued gains.
💪 RSI Above 50
The Relative Strength Index (RSI) is comfortably above the 50 level, indicating strong buyer strength and confirming the bullish momentum.
📌 Learners Takeaway
With the intermediate downtrend reversal, bullish moving average crossover, and RSI strength, Bank of India shows a textbook setup for trend continuation. Traders and investors may find this an opportune moment to align with the prevailing uptrend, while keeping an eye on price action near key support and resistance zonesfor validation.
Live chart Example
Disclaimer
The information and publications are not meant to be, and do not constitute, financial, investment, trading, or other types of advice or recommendations supplied or endorsed by TradingView. Read more in the Terms of Use.
Disclaimer
The information and publications are not meant to be, and do not constitute, financial, investment, trading, or other types of advice or recommendations supplied or endorsed by TradingView. Read more in the Terms of Use.
