🔎 Intro / Overview
___________________________________________________________
📌 How to Use
___________________________________________________________
🎯 Trading Plan
___________________________________________________________
📊 Chart Explanation
___________________________________________________________
👀 Observation
___________________________________________________________
❗ Why It Matters?
___________________________________________________________
🎯 Conclusion
___________________________________________________________
⚠️ Disclaimer
- The Bullish Ascending Triangle is a continuation pattern that signals strength in an uptrend 📈.
- It forms as price creates Higher Highs and Higher Lows in sequence, compressing toward a breakout level.
- This structure shows buyers stepping in at higher levels while sellers gradually weaken, often leading to a bullish breakout.
___________________________________________________________
📌 How to Use
- Identify a prior uptrend → the base condition for Ascending Triangle.
- Price consolidates by forming Higher Lows and retesting the same resistance level.
- Validation → Mark the close of candle that break upper trend line
- Devalidation → Swing Low ( when any candle break the upper trend line).
- Entry → Confirmed only when price closes above the Validation level.
- Stop Loss → Swing Low (Candle break the upper trend line ).
- Target → Equal to the measured height of the triangle or 1R multiples.
___________________________________________________________
🎯 Trading Plan
- Entry → On breakout close above Validation level.
- Stop Loss → Swing Low (Candle break the upper trend line ).
- Target → Conservative 1R, Moderate 2R,
- Remaining lots → Trail using ATR, Fibonacci, or structural swing highs.
___________________________________________________________
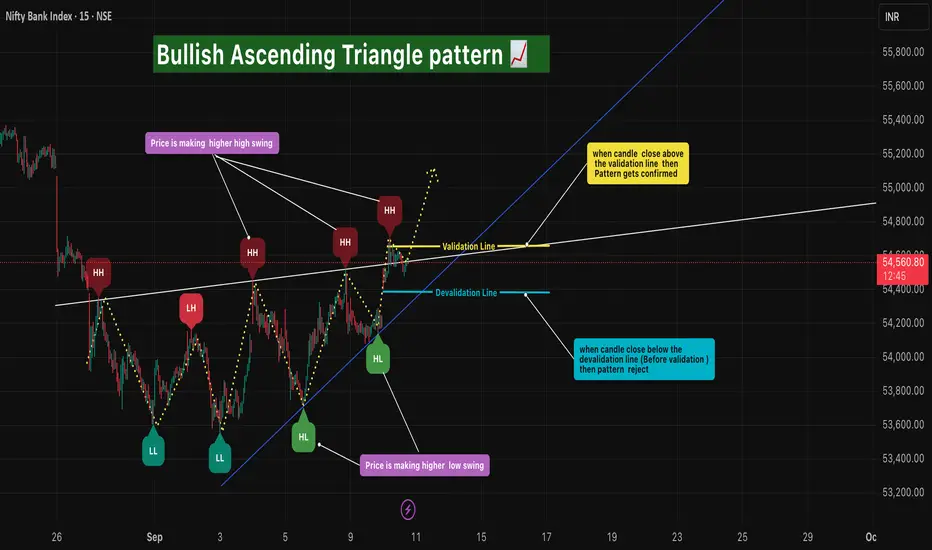
📊 Chart Explanation
- Price starts in an uptrend.
- Forms a sequence of Higher Highs and Higher Lows.
- Resistance holds flat at the top, forming the Ascending Triangle shape 🔺.
- Breakout above the Higher High Validation line triggers entry ✅.
- Swing Low = Devalidation ⛔.
- Target 1 achieved 🎯, trailing used for further upside 🚀.
___________________________________________________________
👀 Observation
- Works best as a continuation pattern in established uptrends.
- A strong bullish breakout candle adds conviction.
- Sideways/choppy markets may cause false breakouts → validation rules filter them.
- Volume confirmation strengthens the setup.
___________________________________________________________
❗ Why It Matters?
- Represents buyer dominance with sellers weakening over time.
- Provides a clear breakout entry with strict SL and TP.
- Helps traders capture trending moves while minimizing false signals.
- Rule-based framework improves discipline and consistency.
___________________________________________________________
🎯 Conclusion
- The Bullish Ascending Triangle Pattern is a reliable continuation signal for trend traders.
- By combining Higher Highs, Higher Lows, and breakout confirmation, traders can enter with confidence, manage risk, and trail profits effectively.
- 🔥 Patterns don’t predict. Rules protect. 🚀
___________________________________________________________
⚠️ Disclaimer
📘 For educational purposes only.
🙅 Not SEBI registered.
❌ Not a buy/sell recommendation.
🧠 Purely a learning resource.
📊 Not Financial Advice.
Note
On 11 September, 2025 (12:15) ⏰, the Entry was successfully validated ✅. - 📌 Stop Loss (SL) → Swing Low = 54,400.00
- 🎯 Target 1 → 1x of Stop Loss distance = 55,022.20
The setup is now active with structured risk management.
Note
-🎯 The projected target of 55,065 has been successfully achieved today.
-📈 This target was anticipated on 10 September during the pattern validation.
-🔄 Remaining positions can now be managed with a trailing stop to protect profits while allowing further upside potential.
Disclaimer
The information and publications are not meant to be, and do not constitute, financial, investment, trading, or other types of advice or recommendations supplied or endorsed by TradingView. Read more in the Terms of Use.
Disclaimer
The information and publications are not meant to be, and do not constitute, financial, investment, trading, or other types of advice or recommendations supplied or endorsed by TradingView. Read more in the Terms of Use.