The market's performance on Friday, September 26, the Bank Nifty has experienced a decisive breakdown, accelerating its corrective move and closing near a crucial support zone. The market is now in a strong bearish trend on all lower timeframes.
Detailed Market Structure Breakdown
4-Hour Chart (Macro Trend)
Structure: The Bank Nifty has confirmed a deep corrective phase. The price has broken below multiple intermediate supports and the crucial 54,750 level. It is now testing the major demand zone around 54,250 - 54,400. This area represents a major support level from the base of the rally that began in early September.
Key Levels:
Major Supply (Resistance): 54,750 - 54,850. This area, which was a strong support, is now the immediate and most critical resistance.
Major Demand (Support): 54,250 - 54,400. This is the key "line in the sand." A sustained break below 54,250 would signal a deeper correction toward the next macro support at 53,500 - 53,750.
Outlook: The short-term macro bias is bearish. The market is sitting on a major support level, and its ability to hold this level on Monday will determine the near-term direction.
1-Hour Chart (Intermediate View)
Structure: The 1H chart is strongly bearish, trading in a well-defined descending channel and consistently making lower lows and lower highs. The price closed right near the channel support and the major horizontal demand zone.
Key Levels:
Immediate Resistance: The upper trendline of the descending channel, currently near 54,750.
Immediate Support: 54,250. This is the level that bulls must defend at the open.
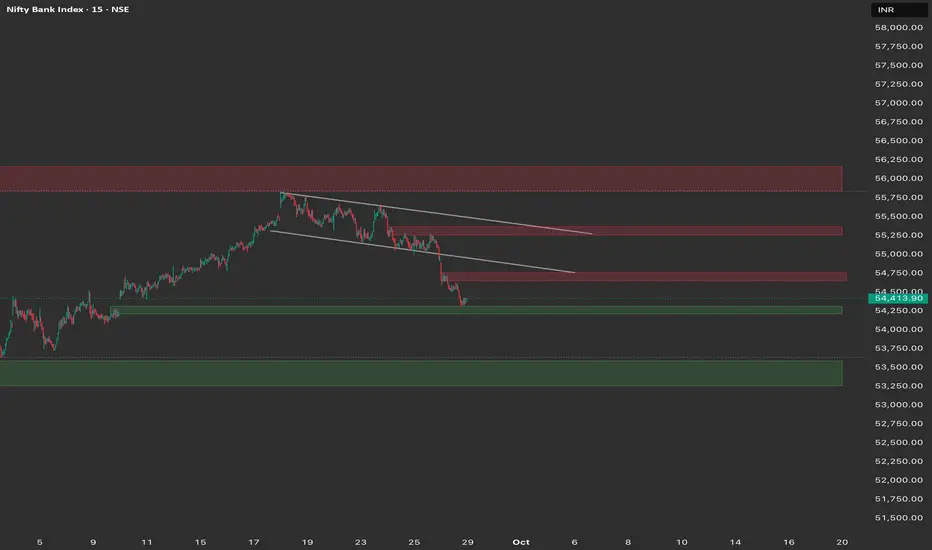
15-Minute Chart (Intraday View)
Structure: The 15M chart confirms the steep bearish momentum. The index is trading at the bottom of its current descending channel. The close right on the 54,300 level suggests a potential for a short-term bounce or a breakdown.
Key Levels:
Intraday Supply: 54,750. This is the immediate resistance, aligning with the upper channel line.
Intraday Demand: 54,250. The crucial level to watch for Monday.
Outlook: The primary strategy is to sell into any rise or on a breakdown, as the overall trend is down.
Trade Plan (Monday, 29th September)
Market Outlook: The Bank Nifty is bearish, but located at a major, high-confluence support zone. The strategy is centered on whether 54,250 holds.
Bearish Scenario (Primary Plan)
Justification: The breakdown below the macro support at 54,250 would confirm the continuation of the strong bearish trend toward the next accumulation zone.
Entry: Short entry on a decisive break and 15-minute candle close below 54,250.
Stop Loss (SL): Place a stop loss above 54,450 (above the immediate swing high).
Targets:
T1: 54,000 (Psychological level).
T2: 53,500 - 53,750 (Major 4H demand zone).
Bullish Scenario (Counter-Trend/Reversal Plan)
Justification: This is a high-risk, counter-trend plan. It relies on the strong demand zone at 54,250 holding firm.
Trigger: A reversal from the 54,250 - 54,400 zone (e.g., a hammer or bullish engulfing candle) or a sustained move and close above 54,850.
Entry: Long entry on a confirmed bounce from 54,250 - 54,400 with a bullish pattern, or on a break above 54,850.
Stop Loss (SL): Below 54,150 (for a bounce trade) or 54,650 (for a breakout trade).
Targets:
T1: 55,000 (Psychological resistance).
T2: 55,250 (Upper end of the descending channel).
Key Levels for Observation:
Immediate Decision Point: The 54,250 - 54,500 zone.
Bearish Confirmation: A break and sustained move below 54,250.
Bullish Confirmation: A recapture of the 54,850 level.
Line in the Sand: 54,250. The overall bullish trend is in serious jeopardy below this level.
Detailed Market Structure Breakdown
4-Hour Chart (Macro Trend)
Structure: The Bank Nifty has confirmed a deep corrective phase. The price has broken below multiple intermediate supports and the crucial 54,750 level. It is now testing the major demand zone around 54,250 - 54,400. This area represents a major support level from the base of the rally that began in early September.
Key Levels:
Major Supply (Resistance): 54,750 - 54,850. This area, which was a strong support, is now the immediate and most critical resistance.
Major Demand (Support): 54,250 - 54,400. This is the key "line in the sand." A sustained break below 54,250 would signal a deeper correction toward the next macro support at 53,500 - 53,750.
Outlook: The short-term macro bias is bearish. The market is sitting on a major support level, and its ability to hold this level on Monday will determine the near-term direction.
1-Hour Chart (Intermediate View)
Structure: The 1H chart is strongly bearish, trading in a well-defined descending channel and consistently making lower lows and lower highs. The price closed right near the channel support and the major horizontal demand zone.
Key Levels:
Immediate Resistance: The upper trendline of the descending channel, currently near 54,750.
Immediate Support: 54,250. This is the level that bulls must defend at the open.
15-Minute Chart (Intraday View)
Structure: The 15M chart confirms the steep bearish momentum. The index is trading at the bottom of its current descending channel. The close right on the 54,300 level suggests a potential for a short-term bounce or a breakdown.
Key Levels:
Intraday Supply: 54,750. This is the immediate resistance, aligning with the upper channel line.
Intraday Demand: 54,250. The crucial level to watch for Monday.
Outlook: The primary strategy is to sell into any rise or on a breakdown, as the overall trend is down.
Trade Plan (Monday, 29th September)
Market Outlook: The Bank Nifty is bearish, but located at a major, high-confluence support zone. The strategy is centered on whether 54,250 holds.
Bearish Scenario (Primary Plan)
Justification: The breakdown below the macro support at 54,250 would confirm the continuation of the strong bearish trend toward the next accumulation zone.
Entry: Short entry on a decisive break and 15-minute candle close below 54,250.
Stop Loss (SL): Place a stop loss above 54,450 (above the immediate swing high).
Targets:
T1: 54,000 (Psychological level).
T2: 53,500 - 53,750 (Major 4H demand zone).
Bullish Scenario (Counter-Trend/Reversal Plan)
Justification: This is a high-risk, counter-trend plan. It relies on the strong demand zone at 54,250 holding firm.
Trigger: A reversal from the 54,250 - 54,400 zone (e.g., a hammer or bullish engulfing candle) or a sustained move and close above 54,850.
Entry: Long entry on a confirmed bounce from 54,250 - 54,400 with a bullish pattern, or on a break above 54,850.
Stop Loss (SL): Below 54,150 (for a bounce trade) or 54,650 (for a breakout trade).
Targets:
T1: 55,000 (Psychological resistance).
T2: 55,250 (Upper end of the descending channel).
Key Levels for Observation:
Immediate Decision Point: The 54,250 - 54,500 zone.
Bearish Confirmation: A break and sustained move below 54,250.
Bullish Confirmation: A recapture of the 54,850 level.
Line in the Sand: 54,250. The overall bullish trend is in serious jeopardy below this level.
Disclaimer
The information and publications are not meant to be, and do not constitute, financial, investment, trading, or other types of advice or recommendations supplied or endorsed by TradingView. Read more in the Terms of Use.
Disclaimer
The information and publications are not meant to be, and do not constitute, financial, investment, trading, or other types of advice or recommendations supplied or endorsed by TradingView. Read more in the Terms of Use.