Detailed Market Structure Breakdown
4-Hour Chart (Macro Trend)
Structure: The Bank Nifty has confirmed a strong bullish reversal. The index decisively broke out of the steep descending corrective channel and closed well above the critical 55,050 - 55,200 support zone. The large bullish candle has moved past the 38.2% Fibonacci retracement of the prior leg down and suggests that the corrective phase is over for now.
Key Levels:
Major Supply (Resistance): 55,800 - 56,000. This remains the key overhead supply zone from the September highs.
Major Demand (Support): 55,000 - 55,200. This area, which includes the FVG (Fair Value Gap) and the broken channel resistance, is now the new, crucial support.
Outlook: The short-term bias has shifted from bearish to strongly bullish. The trend is now "Buy on Dips" as the Bank Nifty is a market leader and its action reinforces the broader market recovery.
1-Hour Chart (Intermediate View)
Structure: The 1H chart shows a clear Break of Structure (BOS) to the upside. The price broke the descending trendline and reclaimed the moving averages. It closed right below the upper trendline of a broader triangular pattern, setting up for a potential breakout.
Key Levels:
Immediate Resistance: The upper boundary of the triangular pattern, near 55,400.
Immediate Support: 55,100 - 55,200.
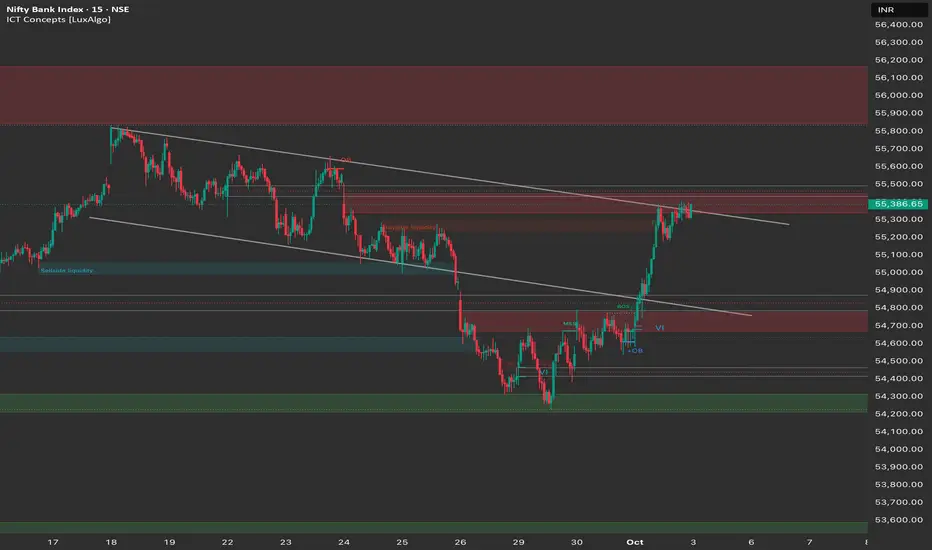
15-Minute Chart (Intraday View)
Structure: The 15M chart confirms the strong bullish momentum. The market saw a significant rally, which included taking out Sell-side Liquidity before the final surge. The price is currently consolidating just below the 55,400 resistance.
Key Levels:
Intraday Supply: 55,400 - 55,500. A breakout here would confirm the continuation of the morning rally.
Intraday Demand: 55,100 - 55,200.
Outlook: Strongly Bullish.
📈 Trade Plan (Friday, 3rd October)
Market Outlook: The Bank Nifty is exhibiting strong bullish momentum after the RBI policy event. The primary strategy will be to buy on dips or buy on continuation.
Bullish Scenario (Primary Plan)
Justification: The sharp reversal and clear break of structure across multiple timeframes suggest a continuation towards the monthly high.
Entry: Long entry on a decisive break and 15-minute candle close above 55,500. Alternatively, look for a dip entry near 55,200 if the market opens flat or with a small gap down.
Stop Loss (SL): Place a stop loss below 55,000 (below the FVG support).
Targets:
T1: 55,800 (Previous swing high).
T2: 56,000 (Major supply zone).
T3: 56,200 (Extension target).
Bearish Scenario (Counter-Trend Plan)
Justification: This high-risk, counter-trend plan only becomes valid if the rally fails dramatically.
Trigger: A decisive break and 1-hour candle close below 55,000.
Entry: Short entry below 55,000.
Stop Loss (SL): Above 55,250.
Targets:
T1: 54,750 (Minor support/FVG).
T2: 54,400 (Deeper demand zone).
Key Levels for Observation:
Immediate Decision Point: 55,400 - 55,500 zone.
Bullish Confirmation: A break and sustained move above 55,500.
Bearish Warning: A move below 55,000 would be a major warning sign.
Line in the Sand: 55,000. A break below this level nullifies the reversal bounce.
Disclaimer
The information and publications are not meant to be, and do not constitute, financial, investment, trading, or other types of advice or recommendations supplied or endorsed by TradingView. Read more in the Terms of Use.
Disclaimer
The information and publications are not meant to be, and do not constitute, financial, investment, trading, or other types of advice or recommendations supplied or endorsed by TradingView. Read more in the Terms of Use.