📊 Market Structure Analysis
🔹 4H Chart
Price has broken out of the short-term downtrend channel and is trading within a rising parallel channel.
Current level: 54,532.
Immediate resistance zone: 54,800 – 55,400 (supply area + FVG).
Immediate support: 54,200 – 54,000 (recent OB + EMA zone).
Trend: Short-term bullish structure but still testing supply zones.
🔹 1H Chart
Strong Break of Structure (BOS) seen above 54,300.
Price is consolidating just below resistance (54,600 – 54,800).
EMA slope is positive, supporting upward bias.
Key liquidity: Buyside liquidity resting above 54,800.
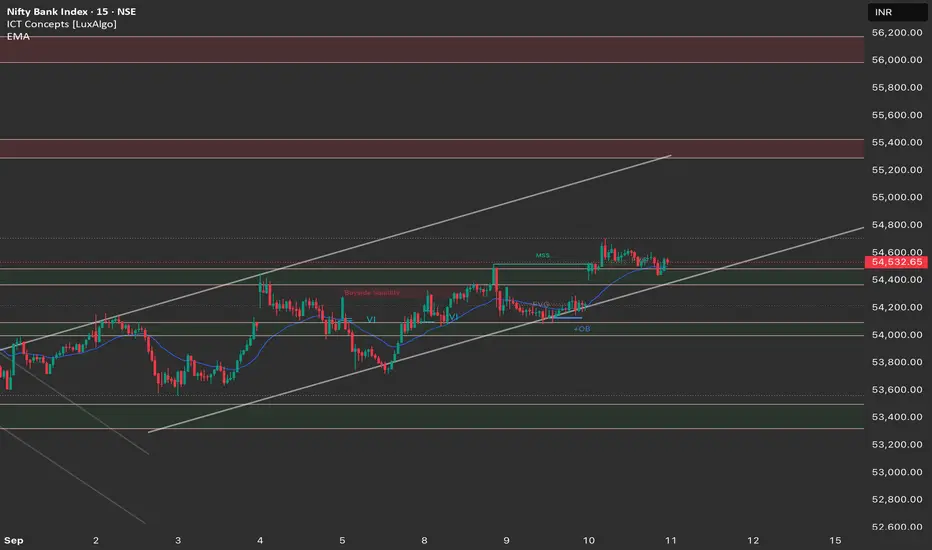
🔹 15M Chart
Price rejected from 54,600 resistance and is now retesting mid-channel support.
Multiple OB + FVG supports in 54,200 – 54,300 area.
Liquidity sweep likely before next move (either up to 54,800+ or breakdown).
🎯 Trade Plan for 11th September
🔹 Long Setup (Bullish Bias)
Entry Zone: 54,200 – 54,300 (OB + EMA support).
Target 1: 54,600
Target 2: 54,800 – 55,000 (liquidity sweep area).
Stop Loss: Below 54,000 (channel + OB invalidation).
🔹 Short Setup (If rejection holds)
Entry Zone: 54,600 – 54,800 (supply rejection).
Target 1: 54,300
Target 2: 54,000
Stop Loss: Above 55,000 (clear BOS against bearish plan).
⚖️ Bias Summary
Primary Bias: Bullish → long from dips towards 54,200 targeting 54,800+.
Alternate Bias: Bearish rejection if 54,600 supply holds → target back to 54,000.
🔹 4H Chart
Price has broken out of the short-term downtrend channel and is trading within a rising parallel channel.
Current level: 54,532.
Immediate resistance zone: 54,800 – 55,400 (supply area + FVG).
Immediate support: 54,200 – 54,000 (recent OB + EMA zone).
Trend: Short-term bullish structure but still testing supply zones.
🔹 1H Chart
Strong Break of Structure (BOS) seen above 54,300.
Price is consolidating just below resistance (54,600 – 54,800).
EMA slope is positive, supporting upward bias.
Key liquidity: Buyside liquidity resting above 54,800.
🔹 15M Chart
Price rejected from 54,600 resistance and is now retesting mid-channel support.
Multiple OB + FVG supports in 54,200 – 54,300 area.
Liquidity sweep likely before next move (either up to 54,800+ or breakdown).
🎯 Trade Plan for 11th September
🔹 Long Setup (Bullish Bias)
Entry Zone: 54,200 – 54,300 (OB + EMA support).
Target 1: 54,600
Target 2: 54,800 – 55,000 (liquidity sweep area).
Stop Loss: Below 54,000 (channel + OB invalidation).
🔹 Short Setup (If rejection holds)
Entry Zone: 54,600 – 54,800 (supply rejection).
Target 1: 54,300
Target 2: 54,000
Stop Loss: Above 55,000 (clear BOS against bearish plan).
⚖️ Bias Summary
Primary Bias: Bullish → long from dips towards 54,200 targeting 54,800+.
Alternate Bias: Bearish rejection if 54,600 supply holds → target back to 54,000.
Disclaimer
The information and publications are not meant to be, and do not constitute, financial, investment, trading, or other types of advice or recommendations supplied or endorsed by TradingView. Read more in the Terms of Use.
Disclaimer
The information and publications are not meant to be, and do not constitute, financial, investment, trading, or other types of advice or recommendations supplied or endorsed by TradingView. Read more in the Terms of Use.