Hello TradingView community, hope you’re doing well! Today I’m sharing an important BankNifty setup as the index approaches a critical make or break zone.
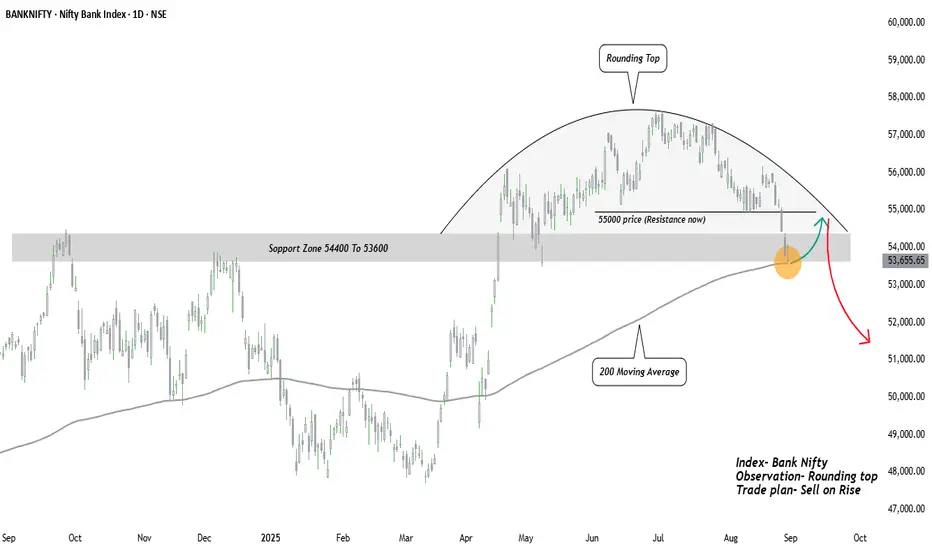
The BankNifty has recently displayed a rounded top structure, a classic sign of distribution and gradual weakness. After weeks of sideways-to-down movement, the index has now broken below the 55000 psychological mark, bringing attention to the major support zone, which also aligns with the 200-day moving average.
Key Observations-:
Rounded Top Distribution-: The slow curve down suggests that sellers are gaining strength while buyers are losing momentum.
Critical Zone at 55000-: Once a strong support, this level has now turned into resistance, confirming supply pressure.
200-Day Moving Average Test-: The index is currently testing its long-term trend indicator. A sustained breakdown below this line can accelerate bearish sentiment.
Volume Dynamics-: Notice how selling volumes are increasing on down days – a further sign of distribution.
Possible Scenarios-:
Bullish Case (Green Path): A short-term rebound from support zone back towards 55000 is possible, but will likely face strong resistance. Only a decisive close above 55500 can negate the bearish structure.
Bearish Case (Red Path): Failure to hold this support may trigger further downside, with potential targets around 52000 and even 51000 in the medium term.
Trading Viewpoint-:
This is a make-or-break zone for BankNifty. While short-term bounces are possible, the overall structure leans bearish unless bulls reclaim 55000+ with strength. Risk management is crucial here traders may consider positioning with caution and keeping stops tight.
This publication purely I am sharing for educational purpose and did not contain any trading advice.
Regards- Amit
Disclaimer
The information and publications are not meant to be, and do not constitute, financial, investment, trading, or other types of advice or recommendations supplied or endorsed by TradingView. Read more in the Terms of Use.
Disclaimer
The information and publications are not meant to be, and do not constitute, financial, investment, trading, or other types of advice or recommendations supplied or endorsed by TradingView. Read more in the Terms of Use.