🔎 Market Structure Analysis
4H Chart (Swing Bias)
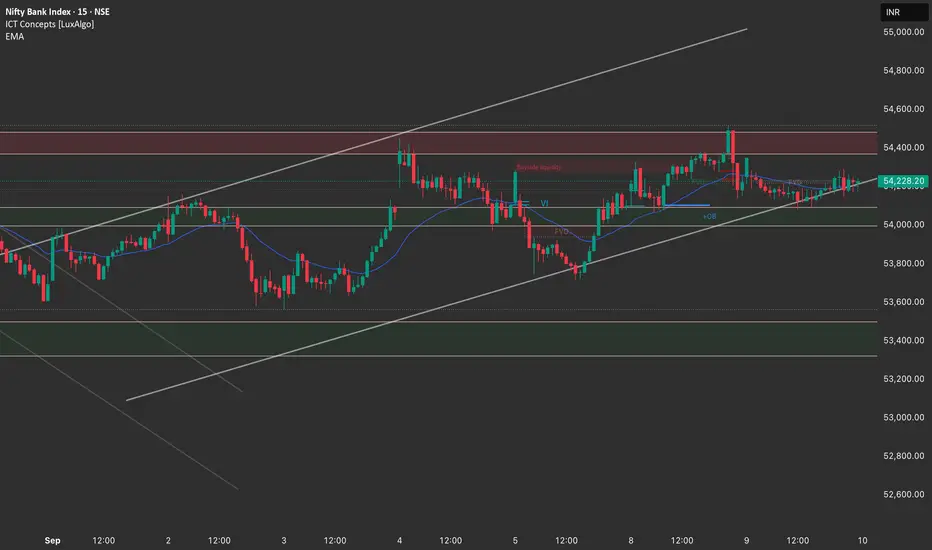
Price is consolidating within a rising channel but facing strong supply zone near 54,400–54,600.
Multiple rejections seen in this area → clear sign of overhead resistance.
Demand zones visible around 54,000 and 53,600, where buyers have previously defended.
Structure: Still range-bound between 53,600 – 54,600, leaning towards distribution near resistance.
1H Chart (Intraday Bias)
Market attempted a breakout above 54,400 but failed, creating a liquidity grab at the top.
Price retested mid-range support (~54,000–54,100) and is currently holding trendline support.
Multiple FVGs left below 54,000 → risk of price revisiting those zones if momentum fails.
Bias: Cautious long only above 54,400; otherwise, sideways with bearish pressure if breakdown happens.
15M Chart (Execution Zone)
Clear rejection candle from supply zone 54,400–54,500.
Small order block support formed at ~54,100.
Upside liquidity resting above 54,600, downside liquidity resting below 53,900.
Ideal trade setup will depend on whether price breaks below 54,100 or sustains above 54,400.
📌 Trade Plan for 10th September
Bullish Scenario (if strength holds)
Entry: Long only above 54,400 (confirmation candle).
Targets: 54,600 → 54,800.
Stoploss: Below 54,150.
Reasoning: Breakout + liquidity sweep above supply zone.
Bearish Scenario (preferred if rejection continues)
Entry: Short near 54,300–54,400 rejection zone.
Targets: 54,050 → 53,800 → 53,600.
Stoploss: Above 54,500.
Reasoning: Rejection from strong supply + FVGs below to be filled.
Neutral / Sideways Plan
If price stays stuck between 54,100–54,400, avoid aggressive trades.
Range scalping possible:
Buy near 54,100 demand with tight SL.
Sell near 54,400 supply with tight SL.
✅ Bias Summary: BankNifty is range-bound with bearish tilt unless it gives a strong breakout above 54,400. Safer to look for shorts from supply until clear evidence of breakout comes.
4H Chart (Swing Bias)
Price is consolidating within a rising channel but facing strong supply zone near 54,400–54,600.
Multiple rejections seen in this area → clear sign of overhead resistance.
Demand zones visible around 54,000 and 53,600, where buyers have previously defended.
Structure: Still range-bound between 53,600 – 54,600, leaning towards distribution near resistance.
1H Chart (Intraday Bias)
Market attempted a breakout above 54,400 but failed, creating a liquidity grab at the top.
Price retested mid-range support (~54,000–54,100) and is currently holding trendline support.
Multiple FVGs left below 54,000 → risk of price revisiting those zones if momentum fails.
Bias: Cautious long only above 54,400; otherwise, sideways with bearish pressure if breakdown happens.
15M Chart (Execution Zone)
Clear rejection candle from supply zone 54,400–54,500.
Small order block support formed at ~54,100.
Upside liquidity resting above 54,600, downside liquidity resting below 53,900.
Ideal trade setup will depend on whether price breaks below 54,100 or sustains above 54,400.
📌 Trade Plan for 10th September
Bullish Scenario (if strength holds)
Entry: Long only above 54,400 (confirmation candle).
Targets: 54,600 → 54,800.
Stoploss: Below 54,150.
Reasoning: Breakout + liquidity sweep above supply zone.
Bearish Scenario (preferred if rejection continues)
Entry: Short near 54,300–54,400 rejection zone.
Targets: 54,050 → 53,800 → 53,600.
Stoploss: Above 54,500.
Reasoning: Rejection from strong supply + FVGs below to be filled.
Neutral / Sideways Plan
If price stays stuck between 54,100–54,400, avoid aggressive trades.
Range scalping possible:
Buy near 54,100 demand with tight SL.
Sell near 54,400 supply with tight SL.
✅ Bias Summary: BankNifty is range-bound with bearish tilt unless it gives a strong breakout above 54,400. Safer to look for shorts from supply until clear evidence of breakout comes.
Disclaimer
The information and publications are not meant to be, and do not constitute, financial, investment, trading, or other types of advice or recommendations supplied or endorsed by TradingView. Read more in the Terms of Use.
Disclaimer
The information and publications are not meant to be, and do not constitute, financial, investment, trading, or other types of advice or recommendations supplied or endorsed by TradingView. Read more in the Terms of Use.