🔎 Bank Nifty Market Structure
4H Chart
Price is trading around 54,100, after rejecting the 54,400–54,500 supply zone (FVG).
A rising channel structure is visible, but today’s rejection candle shows weakness.
Strong demand still lies at 53,600–53,400 zone (green block).
👉 Overall bias: Neutral to mildly bearish unless 54,400 is reclaimed convincingly.
1H Chart
Market structure shows:
A recent Market Structure Shift (MSS) at ~54,200.
Current price is hovering inside a demand block / FVG around 54,000–53,950.
Upside supply remains intact at 54,400–54,500.
Break of 53,950 could accelerate selling pressure.
👉 Short-term structure: Range between 53,950–54,400.
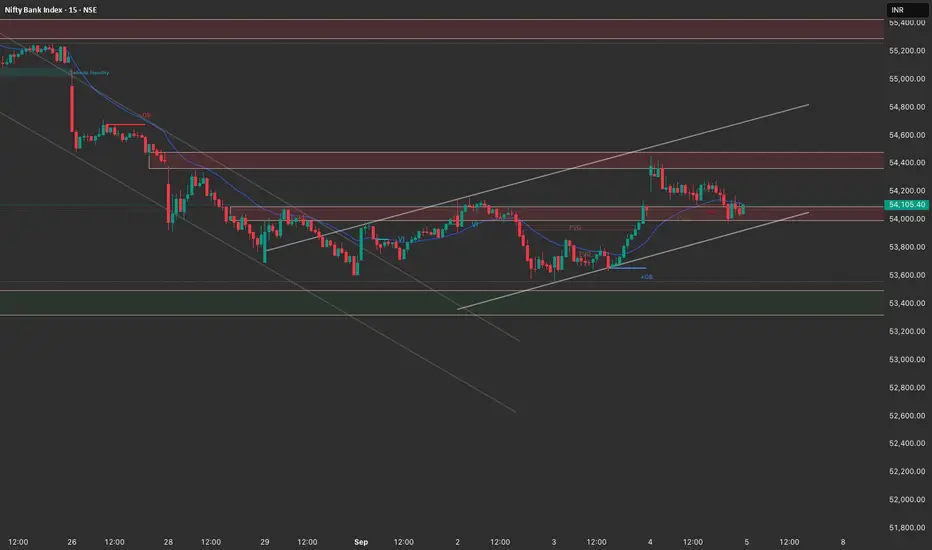
15M Chart
Intraday price action shows repeated rejections from 54,300–54,400.
Price is consolidating above a micro demand zone at 54,000.
Clean liquidity gap remains below at 53,800–53,600.
👉 Intraday tone: Bearish bias if 54,000 breaks, otherwise chop.
📌 Trade Plan for 5th September
Scenario 1: Bearish Continuation
Trigger: Breakdown below 54,000 with momentum.
Entry: Short on 53,980–54,000 break.
Targets:
T1 = 53,800
T2 = 53,600 (major demand zone)
Stop Loss: 54,200 (above supply/FVG).
Scenario 2: Bullish Relief Rally
Trigger: Strong rejection candle from 54,000–53,950 zone.
Entry: Long above 54,100.
Targets:
T1 = 54,300
T2 = 54,400–54,500 (supply zone, book profits here)
Stop Loss: 53,900.
Key Notes
Market is in a tight range (53,950–54,400).
Best trades will come from range extremes: short at supply, long at demand.
Avoid chasing in the middle zone; let price confirm with structure.
✅ Bias for Tomorrow (5th Sept):
Slightly bearish unless Bank Nifty reclaims 54,400+. High-probability short trades if 54,000 breaks.
4H Chart
Price is trading around 54,100, after rejecting the 54,400–54,500 supply zone (FVG).
A rising channel structure is visible, but today’s rejection candle shows weakness.
Strong demand still lies at 53,600–53,400 zone (green block).
👉 Overall bias: Neutral to mildly bearish unless 54,400 is reclaimed convincingly.
1H Chart
Market structure shows:
A recent Market Structure Shift (MSS) at ~54,200.
Current price is hovering inside a demand block / FVG around 54,000–53,950.
Upside supply remains intact at 54,400–54,500.
Break of 53,950 could accelerate selling pressure.
👉 Short-term structure: Range between 53,950–54,400.
15M Chart
Intraday price action shows repeated rejections from 54,300–54,400.
Price is consolidating above a micro demand zone at 54,000.
Clean liquidity gap remains below at 53,800–53,600.
👉 Intraday tone: Bearish bias if 54,000 breaks, otherwise chop.
📌 Trade Plan for 5th September
Scenario 1: Bearish Continuation
Trigger: Breakdown below 54,000 with momentum.
Entry: Short on 53,980–54,000 break.
Targets:
T1 = 53,800
T2 = 53,600 (major demand zone)
Stop Loss: 54,200 (above supply/FVG).
Scenario 2: Bullish Relief Rally
Trigger: Strong rejection candle from 54,000–53,950 zone.
Entry: Long above 54,100.
Targets:
T1 = 54,300
T2 = 54,400–54,500 (supply zone, book profits here)
Stop Loss: 53,900.
Key Notes
Market is in a tight range (53,950–54,400).
Best trades will come from range extremes: short at supply, long at demand.
Avoid chasing in the middle zone; let price confirm with structure.
✅ Bias for Tomorrow (5th Sept):
Slightly bearish unless Bank Nifty reclaims 54,400+. High-probability short trades if 54,000 breaks.
Disclaimer
The information and publications are not meant to be, and do not constitute, financial, investment, trading, or other types of advice or recommendations supplied or endorsed by TradingView. Read more in the Terms of Use.
Disclaimer
The information and publications are not meant to be, and do not constitute, financial, investment, trading, or other types of advice or recommendations supplied or endorsed by TradingView. Read more in the Terms of Use.